UNITED STATES
SECURITIES AND EXCHANGE COMMISSION
Washington, DC 20549
FORM 8-K
CURRENT REPORT
Pursuant to Section 13 or 15(d) of The Securities Exchange Act of 1934
Date of Report (Date of earliest event reported): May 5, 2017
Federal National Mortgage Association
(Exact name of registrant as specified in its charter)
Federally chartered corporation | 000-50231 | 52-0883107 | ||
(State or other jurisdiction of incorporation) | (Commission File Number) | (IRS Employer Identification Number) | ||
3900 Wisconsin Avenue, NW Washington, DC | 20016 | |||
(Address of principal executive offices) | (Zip Code) | |||
Registrant’s telephone number, including area code: (800) 2FANNIE (800-232-6643)
(Former name or former address, if changed since last report): ______________
Check the appropriate box below if the Form 8-K filing is intended to simultaneously satisfy the filing obligation of the registrant under any of the following provisions (see General Instruction A.2. below):
¨ | Written communications pursuant to Rule 425 under the Securities Act (17 CFR 230.425) |
¨ | Soliciting material pursuant to Rule 14a-12 under the Exchange Act (17 CFR 240.14a-12) |
¨ | Pre-commencement communications pursuant to Rule 14d-2(b) under the Exchange Act (17 CFR 240.14d-2(b)) |
¨ | Pre-commencement communications pursuant to Rule 13e-4(c) under the Exchange Act (17 CFR 240.13e-4(c)) |
Indicate by check mark whether the registrant is an emerging growth company as defined in Rule 405 of the Securities Act of 1933 (§203.405 of this chapter) or Rule 12b-2 of the Securities Exchange Act of 1934 (§240.12b-2 of this chapter).
Emerging growth company ¨ | |
If an emerging growth company, indicate by check mark if the registrant has elected not to use the extended transition period for complying with any new or revised financial accounting standards provided pursuant to Section 13(a) of the Exchange Act. ¨
The information in this report, including information in the exhibits submitted herewith, shall not be deemed “filed” for purposes of Section 18 of the Securities Exchange Act of 1934, or otherwise subject to the liabilities of Section 18, nor shall it be deemed incorporated by reference into any disclosure document relating to Fannie Mae (formally known as the Federal National Mortgage Association), except to the extent, if any, expressly incorporated by specific reference in that document.
Item 2.02 Results of Operations and Financial Condition.
On May 5, 2017, Fannie Mae filed its quarterly report on Form 10-Q for the quarter ended March 31, 2017 and issued a news release reporting its financial results for the periods covered by the Form 10-Q. The news release, a copy of which is furnished as Exhibit 99.1 to this report, is incorporated herein by reference. A copy of the news release may also be found on Fannie Mae’s website, www.fanniemae.com, in the “About Us” section under “Investor Relations/Quarterly and Annual Results.” Information appearing on the company’s website is not incorporated into this report.
Item 7.01 Regulation FD Disclosure.
On May 5, 2017, Fannie Mae posted to its website a 2017 First Quarter Credit Supplement presentation consisting primarily of information about Fannie Mae’s guaranty book of business. The presentation, a copy of which is furnished as Exhibit 99.2 to this report, is incorporated herein by reference. A copy of the presentation may also be found on Fannie Mae’s website, www.fanniemae.com, in the “About Us” section under “Investor Relations/Quarterly and Annual Results.”
Item 9.01 Financial Statements and Exhibits.
(d) Exhibits. The exhibit index filed herewith is incorporated herein by reference.
SIGNATURES
Pursuant to the requirements of the Securities Exchange Act of 1934, the registrant has duly caused this report to be signed on its behalf by the undersigned hereunto duly authorized.
FEDERAL NATIONAL MORTGAGE ASSOCIATION | ||
By | /s/ David C. Benson | |
David C. Benson | ||
Executive Vice President and Chief Financial Officer | ||
Date: May 5, 2017
EXHIBIT INDEX
The following exhibits are submitted herewith:
Exhibit Number | Description of Exhibit | |
99.1 | ||
99.2 | ||

Resource Center: 1-800-232-6643
Exhibit 99.1
Contact: Pete Bakel
202-752-2034
Date: May 5, 2017
Fannie Mae Reports Net Income of $2.8 Billion and Comprehensive Income of $2.8 Billion for First Quarter 2017
• | Fannie Mae expects to pay $2.8 billion in dividends to Treasury in June 2017. With the expected June 2017 dividend payment, Fannie Mae will have paid a total of $162.7 billion in dividends to Treasury. |
• | Fannie Mae was the largest provider of liquidity to the mortgage market in the first quarter of 2017, providing approximately $136 billion in mortgage financing that enabled families to buy, refinance, or rent homes. |
• | Fannie Mae is focused on providing value to the housing finance system by: |
◦ | delivering increased speed, simplicity, and certainty to customers and serving their needs by building a company that is efficient, innovative, and continuously improving; |
◦ | implementing innovations that deliver greater value and reduced risk to lenders, such as the company’s Day 1 Certainty™ initiative with verification tools to expand representation and warranty relief; and |
◦ | helping make predictable long-term fixed-rate mortgages, including the 30-year fixed-rate mortgage, available to families across the country. |
• | Fannie Mae continues to increase the role of private capital in the mortgage market and reduce the risk to Fannie Mae’s business, taxpayers, and the housing finance system through its credit risk transfer transactions. As of March 31, 2017, approximately 26 percent of the loans in the company’s single-family conventional guaranty book of business, measured by unpaid principal balance, were covered by a credit risk transfer transaction. |
WASHINGTON, DC — Fannie Mae (FNMA/OTC) reported net income of $2.8 billion and comprehensive income of $2.8 billion for the first quarter of 2017. The company reported a positive net worth of $3.4 billion as of March 31, 2017. As a result, the company expects to pay Treasury a $2.8 billion dividend in June 2017.
“Across our business, we are creating new ways to help our customers make the mortgage process easier and safer, and provide options that are affordable to more borrowers,” said Timothy J. Mayopoulos, president and chief executive officer. “Both the market and our operations continued to strengthen, and our progress was reflected in another profitable quarter. We look forward to advancing our vision to create a digital mortgage process, and make new strides in our efforts to encourage the creation of affordable multifamily housing.”
First Quarter 2017 Results — Fannie Mae’s net income of $2.8 billion for the first quarter of 2017 compares to net income of $5.0 billion for the fourth quarter of 2016. The decrease in net income was due primarily to:
• | Significantly smaller increases in interest rates in the first quarter of 2017 as compared with the fourth quarter of 2016. |
◦ | Large increases in longer-term interest rates in the fourth quarter of 2016 resulted in substantial fair value gains on the company’s risk management derivatives for the quarter as well as credit-related expenses that partially offset these gains. |
◦ | By contrast, interest rates increased only slightly in the first quarter of 2017, and therefore did not have a substantial impact on the fair value of the company’s risk management derivatives or its credit-related income for the quarter. |

First Quarter 2017 Results | 1 | |
SUMMARY OF FIRST QUARTER 2017 RESULTS

(Dollars in millions) | 1Q17 | 4Q16 | Variance | 1Q17 | 1Q16 | Variance | ||||||||||||||||||
Net interest income | $ | 5,346 | $ | 5,805 | $ | (459 | ) | $ | 5,346 | $ | 4,769 | $ | 577 | |||||||||||
Fee and other income | 249 | 414 | (165 | ) | 249 | 203 | 46 | |||||||||||||||||
Net revenues | 5,595 | 6,219 | (624 | ) | 5,595 | 4,972 | 623 | |||||||||||||||||
Investment gains (losses), net | (9 | ) | 322 | (331 | ) | (9 | ) | 69 | (78 | ) | ||||||||||||||
Fair value gains (losses), net | (40 | ) | 3,890 | (3,930 | ) | (40 | ) | (2,813 | ) | 2,773 | ||||||||||||||
Administrative expenses | (684 | ) | (714 | ) | 30 | (684 | ) | (688 | ) | 4 | ||||||||||||||
Credit-related income (expense) | ||||||||||||||||||||||||
Benefit (provision) for credit losses | 396 | (1,303 | ) | 1,699 | 396 | 1,184 | (788 | ) | ||||||||||||||||
Foreclosed property expense | (217 | ) | (137 | ) | (80 | ) | (217 | ) | (334 | ) | 117 | |||||||||||||
Total credit-related income (expense) | 179 | (1,440 | ) | 1,619 | 179 | 850 | (671 | ) | ||||||||||||||||
Temporary Payroll Tax Cut Continuation Act of 2011 (TCCA) fees | (503 | ) | (487 | ) | (16 | ) | (503 | ) | (440 | ) | (63 | ) | ||||||||||||
Other expenses, net | (382 | ) | (210 | ) | (172 | ) | (382 | ) | (264 | ) | (118 | ) | ||||||||||||
Income before federal income taxes | 4,156 | 7,580 | (3,424 | ) | 4,156 | 1,686 | 2,470 | |||||||||||||||||
Provision for federal income taxes | (1,383 | ) | (2,545 | ) | 1,162 | (1,383 | ) | (550 | ) | (833 | ) | |||||||||||||
Net income | $ | 2,773 | $ | 5,035 | $ | (2,262 | ) | $ | 2,773 | $ | 1,136 | $ | 1,637 | |||||||||||
Total comprehensive income | $ | 2,779 | $ | 4,871 | $ | (2,092 | ) | $ | 2,779 | $ | 936 | $ | 1,843 | |||||||||||
Dividends distributed or available for distribution to senior preferred stockholder | $ | (2,779 | ) | $ | (5,471 | ) | $ | 2,692 | $ | (2,779 | ) | $ | (919 | ) | $ | (1,860 | ) | |||||||
Net revenues, which consist of net interest income and fee and other income, were $5.6 billion for the first quarter of 2017, compared with $6.2 billion for the fourth quarter of 2016.
The company has two primary sources of net interest income: (1) the guaranty fees it receives for managing the credit risk on loans underlying Fannie Mae mortgage-backed securities held by third parties; and (2) the difference between interest income earned on the assets in its retained mortgage portfolio and the interest expense associated with the debt that funds those assets.
Net interest income was $5.3 billion for the first quarter of 2017, compared with $5.8 billion for the fourth quarter of 2016. The decrease in net interest income for the first quarter of 2017 was due primarily to lower amortization income from mortgage prepayments due to lower refinance activity and lower interest income due to a decline in the average balance of the company’s retained mortgage portfolio as the company continued to reduce this portfolio.
In recent periods, an increasing portion of Fannie Mae’s net interest income has been derived from guaranty fees rather than from the company’s retained mortgage portfolio assets. This shift has been driven by both the guaranty fee increases the company implemented in 2012 and the reduction of the company’s retained mortgage portfolio. More than 75 percent of the company’s net interest income in the first quarter of 2017 was derived from its guaranty business. The company expects that guaranty fees will continue to account for an increasing portion of its net interest income.
First Quarter 2017 Results | 2 | |

Net fair value losses were $40 million in the first quarter of 2017, compared with net fair value gains of $3.9 billion in the fourth quarter of 2016. Net fair value losses for the first quarter of 2017 were due primarily to losses on Connecticut Avenue Securities™ debt reported at fair value resulting from tightening spreads between Connecticut Avenue Securities yields and LIBOR during the quarter. Net fair value losses for the first quarter of 2017 were partially offset by gains on the company’s risk management derivatives due primarily to increases in longer-term swap rates during the first quarter of 2017. Net fair value gains in the fourth quarter of 2016 were due primarily to increases in longer-term interest rates positively impacting the value of the company’s risk management derivatives. Net fair value gains in the fourth quarter of 2016 also were driven by gains on commitments to sell mortgage-related securities driven by a decrease in prices as interest rates increased during the commitment periods in the quarter.
The estimated fair value of the company’s derivatives and securities may fluctuate substantially from period to period because of changes in interest rates, the yield curve, mortgage and credit spreads, implied volatility, and activity related to these financial instruments.

Credit-related income (expense) consists of a benefit or provision for credit losses and foreclosed property expense. Credit-related income was $179 million in the first quarter of 2017, compared with credit-related expense of $1.4 billion in the fourth quarter of 2016. Credit-related income in the first quarter of 2017 was driven primarily by an increase in actual and forecasted home prices.
Credit-related expense in the fourth quarter of 2016 was due primarily to a provision for credit losses driven primarily by an increase in actual and projected interest rates during the quarter. The increase in actual and projected interest rates in the fourth quarter of 2016 increased the impairment on the company’s individually impaired loans primarily related to concessions provided on its modified loans, which was the driver of the provision for credit losses for the quarter.
First Quarter 2017 Results | 3 | |

VARIABILITY OF FINANCIAL RESULTS
Fannie Mae expects to remain profitable on an annual basis for the foreseeable future; however, certain factors, such as changes in interest rates or home prices, could result in significant volatility in the company’s financial results from quarter to quarter or year to year. Fannie Mae’s future financial results also will be affected by a number of other factors, including: the company’s guaranty fee rates; the volume of single-family mortgage originations in the future; the size, composition, and quality of its retained mortgage portfolio and guaranty book of business; and economic and housing market conditions. Although Fannie Mae expects to remain profitable on an annual basis for the foreseeable future, due to the company’s limited and declining capital reserves (which decrease to zero in 2018) and the potential for significant volatility in its financial results, the company could experience a net worth deficit in a future quarter. If Fannie Mae experiences a net worth deficit in a future quarter, the company will be required to draw additional funds from Treasury under the senior preferred stock purchase agreement to avoid being placed into receivership.
The company’s expectations for its future financial results do not take into account the impact on its business of potential future legislative or regulatory changes, which could have a material impact on the company’s financial results, particularly the enactment of housing finance reform legislation, corporate income tax reform legislation, and changes in accounting standards. For example, the current Administration proposes reducing the U.S. corporate income tax rate. Under applicable accounting standards, a significant reduction in the U.S. corporate income tax rate would require the company to record a substantial reduction in the value of its deferred tax assets in the quarter in which the legislation is enacted. Thus, if legislation significantly lowering the U.S. corporate income tax rate is enacted, the company expects to incur a significant net loss and net worth deficit for the quarter in which the legislation is enacted and could potentially incur a net loss for that year. If the company experiences a net worth deficit in a future quarter, it will be required to draw additional funds from Treasury under the senior preferred stock purchase agreement in order to avoid being placed into receivership. For additional information on factors that affect the company’s financial results, please refer to the company’s quarterly report on Form 10-Q for the quarter ended March 31, 2017 (the “First Quarter 2017 Form 10-Q”).
SUMMARY OF FIRST QUARTER 2017 BUSINESS SEGMENT RESULTS
Fannie Mae’s two reportable business segments—Single-Family and Multifamily—engage in complementary business activities in pursuing Fannie Mae’s vision to be America’s most valued housing partner and to provide liquidity, access to credit, and affordability in all U.S. housing markets at all times, while effectively managing and reducing risk to Fannie Mae’s business, taxpayers, and the housing finance system. In support of this vision, Fannie Mae is focused on: advancing a sustainable and reliable business model that reduces risk to the housing finance system and taxpayers; providing reliable, large-scale access to affordable mortgage credit for qualified borrowers and helping struggling homeowners; and serving customer needs by building a company that is efficient, innovative, and continuously improving.
First Quarter 2017 Results | 4 | |

(Dollars in millions) | 1Q17 | 4Q16 | Variance | 1Q17 | 1Q16 | Variance | ||||||||||||||||||
Single-Family Segment: | ||||||||||||||||||||||||
Net interest income | $ | 4,756 | $ | 5,178 | $ | (422 | ) | $ | 4,756 | $ | 4,245 | $ | 511 | |||||||||||
Fee and other income | 76 | 299 | (223 | ) | 76 | 67 | 9 | |||||||||||||||||
Net revenues | 4,832 | 5,477 | (645 | ) | 4,832 | 4,312 | 520 | |||||||||||||||||
Credit-related income (expense) | 184 | (1,456 | ) | 1,640 | 184 | 828 | (644 | ) | ||||||||||||||||
Investment gains (losses), net | (50 | ) | 209 | (259 | ) | (50 | ) | 56 | (106 | ) | ||||||||||||||
Fair value gains (losses), net | (12 | ) | 3,988 | (4,000 | ) | (12 | ) | (2,850 | ) | 2,838 | ||||||||||||||
Administrative expenses | (601 | ) | (630 | ) | 29 | (601 | ) | (609 | ) | 8 | ||||||||||||||
TCCA fees | (503 | ) | (487 | ) | (16 | ) | (503 | ) | (440 | ) | (63 | ) | ||||||||||||
Other expenses | (256 | ) | (239 | ) | (17 | ) | (256 | ) | (246 | ) | (10 | ) | ||||||||||||
Income before federal income taxes | 3,594 | 6,862 | (3,268 | ) | 3,594 | 1,051 | 2,543 | |||||||||||||||||
Provision for federal income taxes | (1,252 | ) | (2,375 | ) | 1,123 | (1,252 | ) | (389 | ) | (863 | ) | |||||||||||||
Net income | $ | 2,342 | $ | 4,487 | $ | (2,145 | ) | $ | 2,342 | $ | 662 | $ | 1,680 | |||||||||||
Multifamily Segment: | ||||||||||||||||||||||||
Net interest income | $ | 590 | $ | 627 | $ | (37 | ) | $ | 590 | $ | 524 | $ | 66 | |||||||||||
Fee and other income | 173 | 115 | 58 | 173 | 136 | 37 | ||||||||||||||||||
Net revenues | 763 | 742 | 21 | 763 | 660 | 103 | ||||||||||||||||||
Credit-related income (expense) | (5 | ) | 16 | (21 | ) | (5 | ) | 22 | (27 | ) | ||||||||||||||
Fair value gains (losses), net | (28 | ) | (98 | ) | 70 | (28 | ) | 37 | (65 | ) | ||||||||||||||
Administrative expenses | (83 | ) | (84 | ) | 1 | (83 | ) | (79 | ) | (4 | ) | |||||||||||||
Other income (expense) | (85 | ) | 142 | (227 | ) | (85 | ) | (5 | ) | (80 | ) | |||||||||||||
Income before federal income taxes | 562 | 718 | (156 | ) | 562 | 635 | (73 | ) | ||||||||||||||||
Provision for federal income taxes | (131 | ) | (170 | ) | 39 | (131 | ) | (161 | ) | 30 | ||||||||||||||
Net income | $ | 431 | $ | 548 | $ | (117 | ) | $ | 431 | $ | 474 | $ | (43 | ) | ||||||||||
Single-Family Business
• | Single-Family net income was $2.3 billion in the first quarter of 2017, compared with $4.5 billion in the fourth quarter of 2016. Net income for the first quarter of 2017 was driven primarily by net interest income and credit-related income. |
• | Single-Family net interest income was $4.8 billion in the first quarter of 2017, compared with $5.2 billion in the fourth quarter of 2016. The decrease in net interest income for the first quarter of 2017 was due primarily to lower amortization income from mortgage prepayments due to lower refinance activity and lower interest income due to a decline in the average balance of the company’s single-family retained mortgage portfolio as the company continued to reduce this portfolio. |
• | Single-Family credit-related income was $184 million in the first quarter of 2017, compared with credit-related expense of $1.5 billion in the fourth quarter of 2016. Credit-related income in the first quarter of 2017 was driven primarily by an increase actual and forecasted home prices. |
• | Single-Family net fair value losses were $12 million in the first quarter of 2017, compared with net fair value gains of $4.0 billion in the fourth quarter of 2016. Net fair value losses for the first quarter of 2017 were due primarily to losses on Connecticut Avenue Securities debt reported at fair value resulting from tightening spreads between Connecticut Avenue Securities yields and LIBOR during the quarter. These fair value losses were partially offset by gains on the company’s risk management derivatives due primarily to increases in longer-term swap rates during the first quarter of 2017. |
First Quarter 2017 Results | 5 | |
Multifamily Business
• | Multifamily net income was $431 million in the first quarter of 2017, compared with $548 million in the fourth quarter of 2016. Net income in the first quarter of 2017 was driven primarily by net interest income. |
• | Multifamily net interest income was $590 million in the first quarter of 2017, compared with $627 million in the fourth quarter of 2016. The decrease in net interest income was due primarily to a decline in the average balance of the multifamily retained mortgage portfolio, as well as lower amortization income due to lower prepayments in the first quarter of 2017. The decrease in net interest income was partially offset by higher guaranty fee income as the company’s multifamily guaranty book of business grew and loans with higher guaranty fees became a larger part of its book, while loans with lower guaranty fees continued to liquidate. |
• | Multifamily net fair value losses were $28 million in the first quarter of 2017, compared with $98 million in the fourth quarter of 2016. Net fair value losses in the first quarter of 2017 were driven primarily by losses on our multifamily commitments to sell mortgage-related securities as a result of increases in prices during the commitment periods. |
• | Multifamily new business volume totaled $17.4 billion for the first quarter of 2017, of which approximately 62 percent counted toward FHFA’ s 2017 multifamily volume cap. |
BUILDING A SUSTAINABLE HOUSING FINANCE SYSTEM
In addition to continuing to provide liquidity and support to the mortgage market, Fannie Mae has invested significant resources toward helping to maintain a safer and sustainable housing finance system for today and build a safer and sustainable housing finance system for the future. The company is pursuing the strategic goals identified by its conservator, the Federal Housing Finance Agency (FHFA). These strategic goals are: maintain, in a safe and sound manner, credit availability and foreclosure prevention activities for new and refinanced mortgages to foster liquid, efficient, competitive, and resilient national housing finance markets; reduce taxpayer risk through increasing the role of private capital in the mortgage market; and build a new single-family infrastructure for use by Fannie Mae and Freddie Mac and adaptable for use by other participants in the secondary market in the future.
ABOUT FANNIE MAE’S CONSERVATORSHIP AND AGREEMENTS WITH TREASURY
Fannie Mae has operated under the conservatorship of FHFA since September 6, 2008. Treasury has made a commitment under a senior preferred stock purchase agreement to provide funding to Fannie Mae under certain circumstances if the company has a net worth deficit. Pursuant to this agreement and the senior preferred stock the company issued to Treasury in 2008, the Director of FHFA has directed Fannie Mae to pay dividends to Treasury on a quarterly basis since entering into conservatorship in 2008.
The chart below shows the funds the company has drawn from Treasury pursuant to the senior preferred stock purchase agreement, as well as the dividend payments the company has made to Treasury on the senior preferred stock, since entering into conservatorship.
First Quarter 2017 Results | 6 | |

__________
(1) | Under the terms of the senior preferred stock purchase agreement, dividend payments the company makes to Treasury do not offset the company’s prior draws of funds from Treasury, and the company is not permitted to pay down draws it has made under the agreement except in limited circumstances. Accordingly, the current aggregate liquidation preference of the senior preferred stock is $117.1 billion, due to the initial $1.0 billion liquidation preference of the senior preferred stock (for which the company did not receive cash proceeds) and the $116.1 billion the company has drawn from Treasury. Amounts may not sum due to rounding. |
(2) | Treasury draws are shown in the period for which requested, not when the funds were received by the company. Fannie Mae has not requested a draw for any period since 2012. |
Fannie Mae expects to pay Treasury a dividend of $2.8 billion for the second quarter of 2017 by June 30, 2017, calculated based on the company’s net worth of $3.4 billion as of March 31, 2017, less the current capital reserve amount of $600 million.
In August 2012, the terms governing the company’s dividend obligations on the senior preferred stock were amended. The amended senior preferred stock purchase agreement does not allow the company to build a capital reserve. Beginning in 2013, the required senior preferred stock dividends each quarter equal the amount, if any, by which the company’s net worth as of the end of the immediately preceding fiscal quarter exceeds an applicable capital reserve amount. The capital reserve amount is $600 million for each quarter of 2017 and will decrease to zero in 2018.
The amount of remaining funding available to Fannie Mae under the senior preferred stock purchase agreement with Treasury is currently $117.6 billion. If the company were to draw additional funds from Treasury under the agreement in a future period, the amount of remaining funding under the agreement would be reduced by the amount of the company’s draw. Dividend payments Fannie Mae makes to Treasury do not restore or increase the amount of funding available to the company under the agreement.
Fannie Mae is not permitted to redeem the senior preferred stock prior to the termination of Treasury’s funding commitment under the senior preferred stock purchase agreement. The limited circumstances under which Treasury’s funding commitment will terminate are described in “Business—Conservatorship and Treasury Agreements” in the company’s annual report on Form 10-K for the year ended December 31, 2016 (the “2016 Form 10-K”).
First Quarter 2017 Results | 7 | |
CREDIT RISK TRANSFER TRANSACTIONS
In late 2013, Fannie Mae began entering into credit risk transfer transactions with the goal of transferring, to the extent economically sensible, a portion of the mortgage credit risk on some of the recently-acquired loans in its single-family book of business in order to reduce the economic risk to the company and taxpayers of future borrower defaults. Fannie Mae’s primary method of achieving this goal has been through the issuance of its Connecticut Avenue Securities (CAS) and its Credit Insurance Risk Transfer™ (CIRT™) transactions. In these transactions, the company transfers to investors a portion of the mortgage credit risk associated with losses on a reference pool of mortgage loans and in exchange pays investors a premium that effectively reduces the guaranty fee income the company retains on the loans.
As of March 31, 2017, $723 billion in outstanding unpaid principal balance of the company’s single-family loans, or approximately 26 percent of the loans in its single-family conventional guaranty book of business measured by unpaid principal balance, were included in a reference pool for a credit risk transfer transaction. During the first quarter of 2017, the company transferred a portion of the mortgage credit risk on single-family mortgages with unpaid principal balance of $108 billion at the time of the transactions.
These transactions increase the role of private capital in the mortgage market and reduce the risk to Fannie Mae’s business, taxpayers, and the housing finance system. Over time, the company expects that a larger portion of its single-family conventional guaranty book of business will be covered by credit risk transfer transactions.
The chart below shows as of the dates specified the total outstanding unpaid principal balance of Fannie Mae’s single-family loans, as well as the percentage of the company’s total single-family conventional guaranty book of business measured by unpaid principal balance, that were included in a reference pool for a credit risk transfer transaction.

CREDIT QUALITY
While continuing to make it possible for families to buy, refinance, or rent homes, Fannie Mae has maintained responsible credit standards. Since 2009, Fannie Mae has seen the effect of the actions it took, beginning in 2008, to significantly strengthen its underwriting and eligibility standards to promote sustainable homeownership and stability in the housing market. Fannie Mae actively monitors the credit risk profile and credit performance of the company’s single-family loan acquisitions, in conjunction with housing market and economic conditions, to determine if its pricing, eligibility, and underwriting criteria accurately reflect the risks associated with loans the company acquires or guarantees. Single-family conventional loans acquired by Fannie Mae in the first quarter of 2017 had a weighted average borrower FICO credit score at origination of 746 and a weighted average original loan-to-value ratio of 73 percent.
As of March 31, 2017, 88 percent of the company’s single-family conventional guaranty book of business consisted of loans acquired since 2009.
First Quarter 2017 Results | 8 | |

* Fannie Mae has acquired HARP loans and other Refi Plus loans under its Refi PlusTM initiative since 2009. Fannie Mae’s Refi Plus initiative offers refinancing flexibility to eligible borrowers who are current on their loans and whose loans are owned or guaranteed by the company and meet certain additional criteria. HARP loans, which have loan-to-value (“LTV”) ratios at origination greater than 80 percent, refers to loans the company has acquired pursuant to the Home Affordable Refinance Program® (“HARP®”). Other Refi Plus loans, which have LTV ratios at origination of 80 percent or less, refers to loans the company has acquired under its Refi Plus initiative other than HARP loans. Loans the company acquires under Refi Plus and HARP are refinancings of loans that were originated prior to June 2009.
The single-family serious delinquency rate for Fannie Mae’s book of business has decreased for 28 consecutive quarters since the first quarter of 2010 and was 1.12 percent as of March 31, 2017, compared with 5.47 percent as of March 31, 2010.
Fannie Mae expects its single-family serious delinquency rate to continue to decline; however, as the single-family serious delinquency rate has already declined significantly over the past several years, the company expects more modest declines in this rate in the future. The company’s single-family serious delinquency rate and the period of time that loans remain seriously delinquent continue to be negatively affected by the length of time required to complete a foreclosure in some states. Other factors that affect the company’s single-family serious delinquency rate include the pace of loan modifications, the timing and volume of nonperforming loan sales we make, servicer performance, and changes in home prices, unemployment levels and other macroeconomic conditions.
First Quarter 2017 Results | 9 | |

Combined loss reserves, which reflect the company’s estimate of the probable losses the company has incurred in its guaranty book of business, including concessions it granted borrowers upon modification of their loans, decreased to $22.5 billion as of March 31, 2017 from $23.8 billion as of December 31, 2016. The decrease in the company’s combined loss reserves for the first quarter of 2017 was driven primarily by redesignations of loans from held for investment to held for sale and charge-offs, which relieved the allowance on these loans, as well as an increase in actual and forecasted home prices. The company’s loss reserves have declined in recent years and are expected to decline further in 2017; however, the company expects a smaller decline in its loss reserves in 2017 than the decline in 2016.

PROVIDING LIQUIDITY AND SUPPORT TO THE MARKET
Liquidity
Fannie Mae provided approximately $136 billion in liquidity to the mortgage market in the first quarter of 2017, through its purchases of loans and guarantees of loans and securities, which resulted in:
• | Approximately 233,000 home purchases |
• | Approximately 303,000 mortgage refinancings |
• | Approximately 202,000 units of multifamily housing financed |
First Quarter 2017 Results | 10 | |

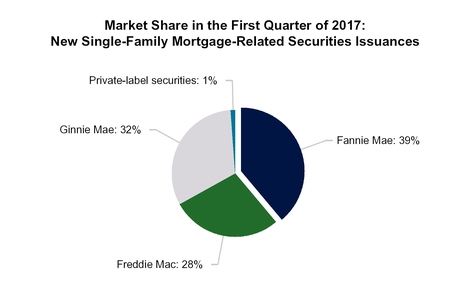
The company was the largest issuer of single-family mortgage-related securities in the secondary market in the first quarter of 2017, with an estimated market share of new single-family mortgage-related securities issuances of 39 percent, compared with 41 percent in the fourth quarter of 2016 and 37 percent in the first quarter of 2016.
The chart below shows the company’s market share of single-family mortgage-related securities issuances in the first quarter of 2017 compared with that of its primary competitors.
Fannie Mae also remained a continuous source of liquidity in the multifamily market in the first quarter of 2017. As of December 31, 2016 (the latest date for which information is available), the company owned or guaranteed approximately 19 percent of the outstanding debt on multifamily properties.
Refinancing Initiatives
Through the company’s Refi Plus initiative, which offers refinancing flexibility to eligible Fannie Mae borrowers and includes HARP, the company acquired approximately 33,000 loans in the first quarter of 2017. Refinancings
First Quarter 2017 Results | 11 | |
delivered to Fannie Mae through Refi Plus in the first quarter of 2017 reduced borrowers’ monthly mortgage payments by an average of $213.

Home Retention Solutions and Foreclosure Alternatives
To reduce the credit losses Fannie Mae ultimately incurs on its book of business, the company has been focusing its efforts on several strategies, including reducing defaults by offering home retention solutions, such as loan modifications.

For the Three Months Ended March 31, | |||||||||||||
2017 | 2016 | ||||||||||||
Unpaid Principal Balance | Number of Loans | Unpaid Principal Balance | Number of Loans | ||||||||||
(Dollars in millions) | |||||||||||||
Home retention solutions: | |||||||||||||
Modifications | $ | 3,343 | 19,928 | $ | 3,451 | 20,899 | |||||||
Repayment plans and forbearances completed | 262 | 1,895 | 175 | 1,296 | |||||||||
Total home retention solutions | 3,605 | 21,823 | 3,626 | 22,195 | |||||||||
Foreclosure alternatives: | |||||||||||||
Short sales | 450 | 2,181 | 611 | 2,995 | |||||||||
Deeds-in-lieu of foreclosure | 178 | 1,153 | 265 | 1,745 | |||||||||
Total foreclosure alternatives | 628 | 3,334 | 876 | 4,740 | |||||||||
Total loan workouts | $ | 4,233 | 25,157 | $ | 4,502 | 26,935 | |||||||
Loan workouts as a percentage of single-family guaranty book of business | 0.59 | % | 0.58 | % | 0.64 | % | 0.62 | % | |||||
Fannie Mae views foreclosure as a last resort. For homeowners and communities in need, the company offers alternatives to foreclosure. In dealing with homeowners in distress, the company first seeks home retention solutions, which enable borrowers to stay in their homes, before turning to foreclosure alternatives.
• | Fannie Mae provided approximately 25,000 loan workouts during the first quarter of 2017 enabling borrowers to avoid foreclosure. |
• | Fannie Mae completed approximately 20,000 loan modifications during the first quarter of 2017. |
First Quarter 2017 Results | 12 | |
FORECLOSURES AND REAL ESTATE OWNED (REO) PROPERTIES
When there is no viable home retention solution or foreclosure alternative that can be applied, the company seeks to move to foreclosure expeditiously in an effort to minimize prolonged delinquencies that can hurt local home values and destabilize communities.

For the Three Months Ended March 31, | |||||||
2017 | 2016 | ||||||
Single-family foreclosed properties (number of properties): | |||||||
Beginning of period inventory of single-family foreclosed properties (REO) | 38,093 | 57,253 | |||||
Total properties acquired through foreclosure | 11,186 | 16,367 | |||||
Dispositions of REO | (14,728 | ) | (21,331 | ) | |||
End of period inventory of single-family foreclosed properties (REO) | 34,551 | 52,289 | |||||
Carrying value of single-family foreclosed properties (dollars in millions) | $ | 3,951 | $ | 5,963 | |||
Single-family foreclosure rate | 0.26 | % | 0.38 | % | |||
• | Fannie Mae acquired 11,186 single-family REO properties, primarily through foreclosure, in the first quarter of 2017, compared with 10,736 in the fourth quarter of 2016. |
• | As of March 31, 2017, the company’s inventory of single-family REO properties was 34,551, compared with 38,093 as of December 31, 2016. The carrying value of the company’s single-family REO was $4.0 billion as of March 31, 2017. |
• | The company’s single-family foreclosure rate was 0.26 percent for the three months ended March 31, 2017. This reflects the annualized total number of single-family properties acquired through foreclosure or deeds-in-lieu of foreclosure as a percentage of the total number of loans in Fannie Mae’s single-family guaranty book of business. |
Fannie Mae’s financial statements for the first quarter of 2017 are available in the accompanying Annex; however, investors and interested parties should read the company’s First Quarter 2017 Form 10-Q, which was filed today with the Securities and Exchange Commission and is available on Fannie Mae’s website, www.fanniemae.com. The company provides further discussion of its financial results and condition, credit performance, and other matters in its First Quarter 2017 Form 10-Q. Additional information about the company’s credit performance, the characteristics of its guaranty book of business, its foreclosure-prevention efforts, and other measures is contained in the “2017 First Quarter Credit Supplement” at www.fanniemae.com.
# # #
In this release, the company has presented a number of estimates, forecasts, expectations, and other forward-looking statements, including statements regarding: its future dividend payments to Treasury; the impact of and future plans with respect to the company’s credit risk transfer transactions; the sources of its future net interest income; the company’s future profitability; the factors that will affect the company’s future financial results; the company’s future serious delinquency rates and the factors that will affect the company’s future single-family serious delinquency rates; the future fair value of the company’s financial instruments; the company’s future loss reserves; and the impact of the company’s actions to reduce credit losses. These estimates, forecasts, expectations, and statements are forward-looking statements based on the company’s current assumptions regarding numerous factors. Actual results, and future projections, could be materially different from what is set forth in the forward-looking statements as a result of: home price changes; interest rate changes; unemployment rates; other macroeconomic and housing market variables; the company’s future serious delinquency rates; the company’s future guaranty fee pricing and the impact of that pricing on the company’s guaranty fee revenues and competitive environment; government policy; credit availability; changes in borrower behavior; the volume of loans it modifies; the effectiveness of its loss mitigation strategies; significant changes in modification and foreclosure activity; the volume and pace of future nonperforming loan sales and their impact on the company’s results and serious delinquency rates; the effectiveness of its management of its real estate owned inventory and pursuit of contractual remedies; changes in the fair value of its assets and liabilities; future legislative or regulatory requirements or changes that have a significant impact on the company’s business, such as the enactment of housing finance reform legislation or corporate income tax reform legislation; actions by FHFA, Treasury, the Department of Housing and
First Quarter 2017 Results | 13 | |
Urban Development or other regulators that affect the company’s business; the size, composition and quality of the company’s guaranty book of business and retained mortgage portfolio; the company’s market share; the life of the loans in the company’s guaranty book of business; future updates to the company’s models relating to loss reserves, including the assumptions used by these models; changes in generally accepted accounting principles; changes to the company’s accounting policies; whether the company’s counterparties meet their obligations in full; effects from activities the company takes to support the mortgage market and help borrowers; the company’s future objectives and activities in support of those objectives, including actions the company may take to reach additional underserved creditworthy borrowers; actions the company may be required to take by FHFA, in its role as the company’s conservator or as its regulator, such as changes in the type of business the company does or the implementation of the Single Security Initiative for Fannie Mae and Freddie Mac; limitations on the company’s business imposed by FHFA, in its role as the company’s conservator or as its regulator; the conservatorship and its effect on the company’s business; the investment by Treasury and its effect on the company’s business; the uncertainty of the company’s future; challenges the company faces in retaining and hiring qualified executives and other employees; the deteriorated credit performance of many loans in the company’s guaranty book of business; a decrease in the company’s credit ratings; defaults by one or more institutional counterparties; resolution or settlement agreements the company may enter into with its counterparties; operational control weaknesses; changes in the fiscal and monetary policies of the Federal Reserve, including any change in the Federal Reserve’s policy toward the reinvestment of principal payments of mortgage-backed securities or any future sales of such securities; changes in the structure and regulation of the financial services industry; the company’s ability to access the debt markets; disruptions in the housing, credit, and stock markets; government investigations and litigation; the company’s reliance on and the performance of the company’s servicers; conditions in the foreclosure environment; global political risks; natural disasters, environmental disasters, terrorist attacks, pandemics, or other major disruptive events; information security breaches or threats; and many other factors, including those discussed in the “Risk Factors” and “Forward-Looking Statements” sections of and elsewhere in the company’s annual report on Form 10-K for the year ended December 31, 2016 and the company’s quarterly report on Form 10-Q for the quarter ended March 31, 2017, and elsewhere in this release.
Fannie Mae provides website addresses in its news releases solely for readers’ information. Other content or information appearing on these websites is not part of this release.
Fannie Mae helps make the 30-year fixed-rate mortgage and affordable rental housing possible for millions of Americans. We partner with lenders to create housing opportunities for families across the country. We are driving positive changes in housing finance to make the home buying process easier, while reducing costs and risk. To learn more, visit fanniemae.com and follow us on twitter.com/fanniemae.
First Quarter 2017 Results | 14 | |
ANNEX
FANNIE MAE
(In conservatorship)
Condensed Consolidated Balance Sheets — (Unaudited)
(Dollars in millions, except share amounts)
As of | |||||||||||
March 31, | December 31, | ||||||||||
2017 | 2016 | ||||||||||
ASSETS | |||||||||||
Cash and cash equivalents | $ | 24,988 | $ | 25,224 | |||||||
Restricted cash (includes $22,642 and $31,536, related to consolidated trusts) | 27,321 | 36,953 | |||||||||
Federal funds sold and securities purchased under agreements to resell or similar arrangements | 35,260 | 30,415 | |||||||||
Investments in securities: | |||||||||||
Trading, at fair value (includes $1,066 and $1,277, respectively, pledged as collateral ) | 37,684 | 40,562 | |||||||||
Available-for-sale, at fair value (includes $113 and $107, respectively, related to consolidated trusts) | 7,721 | 8,363 | |||||||||
Total investments in securities | 45,405 | 48,925 | |||||||||
Mortgage loans: | |||||||||||
Loans held for sale, at lower of cost or fair value | 5,024 | 2,899 | |||||||||
Loans held for investment, at amortized cost: | |||||||||||
Of Fannie Mae | 187,211 | 204,318 | |||||||||
Of consolidated trusts | 2,939,396 | 2,896,001 | |||||||||
Total loans held for investment (includes $11,683 and $12,057, respectively, at fair value) | 3,126,607 | 3,100,319 | |||||||||
Allowance for loan losses | (22,129 | ) | (23,465 | ) | |||||||
Total loans held for investment, net of allowance | 3,104,478 | 3,076,854 | |||||||||
Total mortgage loans | 3,109,502 | 3,079,753 | |||||||||
Deferred tax assets, net | 32,647 | 33,530 | |||||||||
Accrued interest receivable (includes $7,089 and $7,064, respectively, related to consolidated trusts) | 7,704 | 7,737 | |||||||||
Acquired property, net | 4,103 | 4,489 | |||||||||
Other assets | 16,824 | 20,942 | |||||||||
Total assets | $ | 3,303,754 | $ | 3,287,968 | |||||||
LIABILITIES AND EQUITY | |||||||||||
Liabilities: | |||||||||||
Accrued interest payable (includes $8,311 and $8,285, respectively, related to consolidated trusts) | $ | 9,588 | $ | 9,431 | |||||||
Debt: | |||||||||||
Of Fannie Mae (includes $9,162 and $9,582, respectively, at fair value) | 327,183 | 327,097 | |||||||||
Of consolidated trusts (includes $36,372 and $36,524, respectively, at fair value) | 2,954,471 | 2,935,219 | |||||||||
Other liabilities (includes $336 and $390, respectively, related to consolidated trusts) | 9,133 | 10,150 | |||||||||
Total liabilities | 3,300,375 | 3,281,897 | |||||||||
Commitments and contingencies | — | — | |||||||||
Stockholders’ equity: | |||||||||||
Senior preferred stock, 1,000,000 shares issued and outstanding | 117,149 | 117,149 | |||||||||
Preferred stock, 700,000,000 shares are authorized—555,374,922 shares issued and outstanding | 19,130 | 19,130 | |||||||||
Common stock, no par value, no maximum authorization—1,308,762,703 shares issued, 1,158,087,567 and 1,158,082,750 shares outstanding, respectively | 687 | 687 | |||||||||
Accumulated deficit | (126,952 | ) | (124,253 | ) | |||||||
Accumulated other comprehensive income | 765 | 759 | |||||||||
Treasury stock, at cost, 150,675,136 and 150,679,953 shares, respectively | (7,400 | ) | (7,401 | ) | |||||||
Total equity | 3,379 | 6,071 | |||||||||
Total liabilities and equity | $ | 3,303,754 | $ | 3,287,968 | |||||||
See Notes to Condensed Consolidated Financial Statements in the First Quarter 2017 Form 10-Q
First Quarter 2017 Results | 15 | |
FANNIE MAE
(In conservatorship)
Condensed Consolidated Statements of Operations and Comprehensive Income — (Unaudited)
(Dollars and shares in millions, except per share amounts)
For the Three Months Ended March 31, | |||||||||
2017 | 2016 | ||||||||
Interest income: | |||||||||
Trading securities | $ | 142 | $ | 120 | |||||
Available-for-sale securities | 101 | 203 | |||||||
Mortgage loans (includes $24,954 and $24,626, respectively, related to consolidated trusts) | 27,047 | 26,961 | |||||||
Other | 94 | 48 | |||||||
Total interest income | 27,384 | 27,332 | |||||||
Interest expense: | |||||||||
Short-term debt | 44 | 51 | |||||||
Long-term debt (includes $20,308 and $20,658, respectively, related to consolidated trusts) | 21,994 | 22,512 | |||||||
Total interest expense | 22,038 | 22,563 | |||||||
Net interest income | 5,346 | 4,769 | |||||||
Benefit for credit losses | 396 | 1,184 | |||||||
Net interest income after benefit for credit losses | 5,742 | 5,953 | |||||||
Investment gains (losses), net | (9 | ) | 69 | ||||||
Fair value losses, net | (40 | ) | (2,813 | ) | |||||
Fee and other income | 249 | 203 | |||||||
Non-interest income (loss) | 200 | (2,541 | ) | ||||||
Administrative expenses: | |||||||||
Salaries and employee benefits | 344 | 364 | |||||||
Professional services | 229 | 215 | |||||||
Occupancy expenses | 46 | 45 | |||||||
Other administrative expenses | 65 | 64 | |||||||
Total administrative expenses | 684 | 688 | |||||||
Foreclosed property expense | 217 | 334 | |||||||
Temporary Payroll Tax Cut Continuation Act of 2011 (“TCCA”) fees | 503 | 440 | |||||||
Other expenses, net | 382 | 264 | |||||||
Total expenses | 1,786 | 1,726 | |||||||
Income before federal income taxes | 4,156 | 1,686 | |||||||
Provision for federal income taxes | (1,383 | ) | (550 | ) | |||||
Net income | 2,773 | 1,136 | |||||||
Other comprehensive income (loss): | |||||||||
Changes in unrealized gains on available-for-sale securities, net of reclassification adjustments and taxes | 8 | (198 | ) | ||||||
Other | (2 | ) | (2 | ) | |||||
Total other comprehensive income (loss) | 6 | (200 | ) | ||||||
Total comprehensive income | $ | 2,779 | $ | 936 | |||||
Net income | $ | 2,773 | $ | 1,136 | |||||
Dividends distributed or available for distribution to senior preferred stockholder | (2,779 | ) | (919 | ) | |||||
Net income (loss) attributable to common stockholders | $ | (6 | ) | $ | 217 | ||||
Earnings (loss) per share: | |||||||||
Basic | $ | 0.00 | $ | 0.04 | |||||
Diluted | 0.00 | 0.04 | |||||||
Weighted-average common shares outstanding: | |||||||||
Basic | 5,762 | 5,762 | |||||||
Diluted | 5,762 | 5,893 | |||||||
See Notes to Condensed Consolidated Financial Statements in the First Quarter 2017 Form 10-Q
First Quarter 2017 Results | 16 | |
FANNIE MAE
(In conservatorship)
Condensed Consolidated Statements of Cash Flows— (Unaudited)
(Dollars in millions)
For the Three Months Ended March 31, | |||||||
2017 | 2016 | ||||||
Net cash provided by (used in) operating activities | $ | 2,673 | $ | (3,111 | ) | ||
Cash flows provided by investing activities: | |||||||
Proceeds from maturities and paydowns of trading securities held for investment | 579 | 975 | |||||
Proceeds from sales of trading securities held for investment | 66 | 792 | |||||
Proceeds from maturities and paydowns of available-for-sale securities | 594 | 883 | |||||
Proceeds from sales of available-for-sale securities | 151 | 3,802 | |||||
Purchases of loans held for investment | (41,206 | ) | (39,935 | ) | |||
Proceeds from repayments of loans acquired as held for investment of Fannie Mae | 6,718 | 5,026 | |||||
Proceeds from sales of loans acquired as held for investment of Fannie Mae | — | 849 | |||||
Proceeds from repayments and sales of loans acquired as held for investment of consolidated trusts | 97,415 | 104,669 | |||||
Net change in restricted cash | 9,632 | (2,994 | ) | ||||
Advances to lenders | (28,703 | ) | (25,635 | ) | |||
Proceeds from disposition of acquired property and preforeclosure sales | 3,454 | 4,129 | |||||
Net change in federal funds sold and securities purchased under agreements to resell or similar arrangements | (4,845 | ) | 9,800 | ||||
Other, net | (330 | ) | (545 | ) | |||
Net cash provided by investing activities | 43,525 | 61,816 | |||||
Cash flows used in financing activities: | |||||||
Proceeds from issuance of debt of Fannie Mae | 230,272 | 180,322 | |||||
Payments to redeem debt of Fannie Mae | (230,655 | ) | (196,016 | ) | |||
Proceeds from issuance of debt of consolidated trusts | 78,443 | 71,723 | |||||
Payments to redeem debt of consolidated trusts | (119,208 | ) | (107,575 | ) | |||
Payments of cash dividends on senior preferred stock to Treasury | (5,471 | ) | (2,859 | ) | |||
Other, net | 185 | (58 | ) | ||||
Net cash used in financing activities | (46,434 | ) | (54,463 | ) | |||
Net increase (decrease) in cash and cash equivalents | (236 | ) | 4,242 | ||||
Cash and cash equivalents at beginning of period | 25,224 | 14,674 | |||||
Cash and cash equivalents at end of period | $ | 24,988 | $ | 18,916 | |||
Cash paid during the period for: | |||||||
Interest | $ | 25,954 | $ | 26,013 | |||
Income taxes | — | 360 | |||||
See Notes to Condensed Consolidated Financial Statements in the First Quarter 2017 Form 10-Q
First Quarter 2017 Results | 17 | |

2017 First Quarter Credit Supplement
May 5, 2017
© 2017 Fannie Mae. Trademarks of Fannie Mae.
Exhibit 99.2

This presentation includes information about Fannie Mae, including information contained in
Fannie Mae’s Quarterly Report on Form 10-Q for the quarter ended March 31, 2017, the “2017
Q1 Form 10-Q.” Some of the terms used in these materials are defined and discussed more
fuly in the 2017 Q1 Form 10-Q and in Fannie Mae’s Form 10-K for the year ended December
31, 2016, the “2016 Form 10-K.” These materials should be reviewed together with the 2017
Q1 Form 10-Q and the 2016 Form 10-K, copies of which are available through the
“SEC Filings” page in the “About Us/Investor Relations” section of Fannie Mae’s website at
www.fanniemae.com.
Some of the information in this presentation is based upon information that we received from
third-party sources such as selers and servicers of mortgage loans. Although we generaly
consider this information reliable, we do not independently verify al reported information.
Due to rounding, amounts reported in this presentation may not add to totals indicated (or
100%).
Unless otherwise indicated data labeled as “YTD 2017” is as of March 31, 2017 or for the first
three months of 2017.
§
.
.§
.
§
§
© 2017 Fannie Mae. Trademarks of Fannie Mae.

© 2017 Fannie Mae. Trademarks of Fannie Mae. 2
Table of Contents
Home Price Growth/Decline Rates in the U.S.
One Year Home Price Change as of 2017 Q1
Home Price Change From 2006 Q3 Through 2017 Q1 5
4
3
Home Prices
Credit Characteristics of Single-Family Business Acquisitions
Credit Risk Profile Summary of Single-Family Business Acquisitions
Certain Credit Characteristics of Single-Family Business Acquisitions: 2006 - 2017
Single-Family Business Acquisitions by Loan Purpose
Credit Characteristics of Single-Family Conventional Guaranty Book of Business by Origination Year
Credit Characteristics of Single-Family Conventional Guaranty Book of Business by Certain Product Features 11
10
9
8
7
6
Credit Profile of Fannie Mae Single-Family Loans
Credit Characteristics of Single-Family Conventional Guaranty Book of Business and Single-Family Real Estate Owned (REO) in Select States
Seriously Delinquent Loan and REO Ending Inventory Share by Select States
Single-Family Short Sales and REO Sales Prices to Unpaid Principal Balance (UPB) of Mortgage Loans 14
13
12
Geographic Credit Profile of Fannie Mae Single-Family Loans and Foreclosed Properties (REO)
Single-Family Loan Workouts
Re-performance Rates of Modified Single-Family Loans 16
15
Workouts of Fannie Mae Single-Family Loans
Credit Loss Concentration of Single-Family Conventional Guaranty Book of Business
Cumulative Default Rates of Single-Family Conventional Guaranty Book of Business by Origination Year 18
17
Additional Credit Information for Fannie Mae Single-Family Loans
Multifamily Credit Profile by Loan Atributes
Serious Delinquency Rates of Multifamily Book of Business
Cumulative Credit Loss Rates of Multifamily Guaranty Book of Business By Acquisition Year 22
21
19-20
Credit Profile of Fannie Mae Multifamily Loans

2006 2007 2008 2009 2010 2011 2012 2013 2014 2015 2016 2017
-10.0%
-5.0%
0.0%
5.0%
10.0%
15.0%
-3.6%
-9.1%
-4.8% -4.2%
-3.5%
2.6%
4.0%
7.7%
4.3% 4.7%
5.8%
0.5%
Fannie Mae Home Price Index
Based on our home price index, we estimate that home prices on a national basis increased by 0.5% in the first quarter of 2017, folowing increases of 5.8% in
2016, 4.7% in 2015, and 4.3% in 2014. Despite the recent increases in home prices, we estimate that, through March 31, 2017, home prices on a national basis
remained 0.7% below their peak in the third quarter of 2006. Our home price estimates are based on preliminary data and are subject to change as additional data
become available.
2006 2007 2008 2009 2010 2011 2012 2013 2014 2015 2016 2017
1.7% -5.4% -12.0% -3.8% -4.1% -3.9% 6.5% 10.7% 4.5% 5.3% 5.7%
S&P/Case-Shiler Index
Home Price Growth/Decline Rates in the U.S.
Note: Estimate based on purchase transactions in Fannie-Freddie acquisition and public deed data available through the end of March 2017. Including subsequent data may lead to materialy diferent results.
* Year-to-date as of March 2017.
© 2017 Fannie Mae. Trademarks of Fannie Mae. 3
*

One Year Home Price Change as of 2017 Q1*
NC
5.5%
2.5%
MI
8.4%
2.3%
SC
3.5%
1.2%
CA
7.4%
19.6%
WY
-1.3%
0.2%
AR
2.3%
0.5%
IA
3.0%
0.7%
IL
3.2%
3.8%
IN
3.8%
1.1%KS
4.5%
0.5%
LA
3.4%
0.9%
ME
3.7%
0.3%
MO
3.6%
1.3%
MS
1.6%
0.4%
ND
0.5%
0.2%
NM
3.3%
0.5%
OH
4.0%
2.0%
OK
2.2%
0.7%
PA
3.1%
3.0%
VA
2.8%
3.5%
WV
4.1%
0.2%
AZ
7.9%
2.5% AL
2.4%
1.0%
CO
9.4%
2.9%
FL
8.2%
5.6%
GA
6.7%
2.7%
ID
6.7%
0.6%
KY
6.6%
0.6%
MN
5.3%
2.1%
MT
6.8%
0.3%
NE
5.5%
0.5%
NV
6.8%
1.0%
NY
5.2%
5.2%
OR
9.2%
1.8%
SD
5.1%
0.2%
TN
8.4%
1.3%
TX
5.6%
6.1%
UT
8.7%
1.2%
WA
9.9%
3.6%
WI
5.4%
1.8%
State: FL
Growth Rate: 8.2%
UPB%**: 5.6%
United States: 5.5%
*Source: Fannie Mae. Home price estimates are based on purchase transactions in Fannie-Freddie acquisition and public deed data available through the end of March 2017. UPB estimates are based on data
available through the end of March 2017. Including subsequent data may lead to materialy diferent results.
** “UPB %” refers to unpaid principal balance of loans on properties in the applicable state as a percentage of unpaid principal balance of single-family conventional guaranty book of business for which Fannie Mae
has access to loan-level information.
© 2017 Fannie Mae. Trademarks of Fannie Mae. 4
AK
1.7%
0.2%
Growth
Rate UPB %**
CT
DC
DE
MA
MD
NH
NJ
RI
VT 0.2%
0.3%
3.8%
0.5%
2.7%
2.9%
0.4%
0.4%
1.3%
2.4%
8.2%
3.6%
5.5%
2.5%
6.2%
3.9%
11.5%
0.7%
HI
4.8%
0.7%
State Growth Rate
Below 0%
0% to 5%
5% to 10%
10% and Above

NC
5.1%
2.5%
SC
2.1%
1.2%
MI
-5.8%
2.3%
AZ
-21.0%
2.5%
FL
-21.9%
5.6%
NV
-28.2%
1.0%
IL
-13.5%
3.8%
CA
-9.4%
19.6%
CO
34.0%
2.9%
IA
13.7%
0.7%
KS
12.9%
0.5% KY11.4%
0.6%
LA
16.4%
0.9%
MT
19.4%
0.3%
ND
51.8%
0.2%
NE
17.4%
0.5%
OK
15.2%
0.7%
SD
25.9%
0.2%
TN
13.0%
1.3%
TX
32.1%
6.1%
UT
18.0%
1.2%
WY
12.2%
0.2%
VA
-9.1%
3.5%
GA
-2.5%
2.7%
ME
-1.5%
0.3%
MN
-2.6%
2.1%
NM
-4.9%
0.5%
OH
-1.9%
2.0%
AL
0.4%
1.0%
AR
4.5%
0.5%
ID
0.6%
0.6%
MO
2.7%
1.3%
MS
0.4%
0.4%
NY
0.6%
5.2%
PA
3.5%
3.0%
OR
9.6%
1.8%
WA
9.3%
3.6%
WV
6.1%
0.2%
IN
7.6%
1.1%
WI
0.4%
1.8%
State: FL
Growth Rate : -21.9%
UPB%**: 5.6%
United States: -0.7%
Home Price Change From 2006 Q3 Through 2017 Q1*
*Source: Fannie Mae. Home price estimates are based on purchase transactions in Fannie-Freddie acquisition and public deed data available through the end of March 2017. UPB estimates are based on data available through the
end of March 2017. Including subsequent data may lead to materialy diferent results.
** “UPB %” refers to unpaid principal balance of loans on properties in the applicable state as a percentage of unpaid principal balance of single-family conventional guaranty book of business for which Fannie Mae has access to
loan-level information.
Note: Home prices on a national basis reached a peak in the third quarter of 2006.
© 2017 Fannie Mae. Trademarks of Fannie Mae. 5
AK
11.4%
0.2%
HI
5.6%
0.7%
Growth
Rate UPB %**
CT
DC
DE
MA
MD
NH
NJ
RI
VT 0.2%
0.3%
3.8%
0.5%
2.7%
2.9%
0.4%
0.4%
1.3%
-1.7%
-15.8%
-18.3%
-6.7%
-18.0%
1.4%
-12.8%
44.3%
-19.5%
State Growth Rate
Below -15%
-15% to -5%
-5% to 0%
0% to 5%
5% to 10%
10% and Above

Q1 2017
Single-Family
Acquisitions
Excl.
Refi Plus
Ful Year 2016
Single-Family
Acquisitions
Excl.
Refi Plus
Q4 2016
Single-Family
Acquisitions
Excl.
Refi Plus
Q3 2016
Single-Family
Acquisitions
Excl.
Refi Plus
Q2 2016
Single-Family
Acquisitions
Excl.
Refi Plus
Q1 2016
Single-Family
Acquisitions
Excl.
Refi Plus
Unpaid Principal Balance (UPB) ($B)
Weighted Average Origination Note Rate 4.00%
$113.4
4.00%
$118.5
3.73%
$558.9
3.74%
$581.0
3.57%
$173.1
3.58%
$178.2
3.66%
$160.2
3.66%
$165.6
3.82%
$129.2
3.83%
$135.0
4.01%
$96.4
4.02%
$102.2
<= 60%
60.01% to 70%
70.01% to 80%
80.01% to 90%
90.01% to 100%
> 100%
Weighted Average Origination LTV Ratio 73.3%
0.0%
14.8%
11.1%
38.6%
14.4%
21.1%
73.2%
0.3%
14.5%
11.1%
37.8%
14.5%
21.7%
73.6%
0.0%
14.8%
11.5%
38.8%
14.5%
20.4%
73.6%
0.4%
14.6%
11.6%
38.1%
14.5%
20.7%
72.0%
0.0%
12.8%
10.6%
37.5%
15.6%
23.5%
71.9%
0.2%
12.7%
10.7%
37.1%
15.6%
23.8%
73.9%
0.0%
15.5%
11.7%
38.4%
14.2%
20.2%
73.8%
0.3%
15.3%
11.8%
37.8%
14.3%
20.6%
74.8%
0.0%
16.3%
12.2%
39.7%
13.8%
18.0%
74.7%
0.4%
16.0%
12.3%
38.9%
13.9%
18.5%
74.6%
0.0%
15.3%
12.0%
40.8%
13.8%
18.1%
74.5%
0.6%
15.0%
12.2%
39.6%
13.9%
18.7%
Origination Loan-to-Value (LTV) Ratio
< 620
620 to < 660
660 to < 700
700 to < 740
>=740
Weighted Average FICO Credit Score 747
60.4%
22.2%
12.7%
4.7%
0.0%
746
59.4%
22.1%
13.0%
5.0%
0.4%
752
64.9%
20.4%
10.9%
3.8%
0.0%
750
63.9%
20.4%
11.3%
4.1%
0.3%
754
66.9%
19.8%
10.0%
3.3%
0.0%
753
66.1%
19.8%
10.3%
3.6%
0.2%
753
66.1%
19.9%
10.4%
3.6%
0.0%
752
65.2%
19.9%
10.7%
3.9%
0.3%
751
63.6%
21.1%
11.4%
3.8%
0.0%
749
62.5%
21.0%
11.8%
4.2%
0.4%
748
61.2%
21.5%
12.6%
4.7%
0.0%
746
59.8%
21.4%
13.0%
5.2%
0.5%
FICO Credit Scores
Credit Characteristics of Single-Family Business Acquisitions
Fixed-rate
Adjustable-rate
Alt-A
Interest Only
Investor
Condo/Co-op
Refinance 53.4%
9.9%
7.3%
0.0%
0.0%
2.2%
97.8%
55.4%
9.8%
7.7%
0.0%
0.3%
2.1%
97.9%
54.0%
9.6%
5.6%
0.0%
0.0%
1.6%
98.4%
55.7%
9.6%
6.0%
0.0%
0.3%
1.5%
98.5%
60.1%
9.4%
5.5%
0.0%
0.0%
1.1%
98.9%
61.2%
9.4%
5.7%
0.0%
0.2%
1.1%
98.9%
51.5%
9.5%
5.2%
0.0%
0.0%
1.6%
98.4%
53.0%
9.5%
5.4%
0.0%
0.2%
1.6%
98.4%
51.3%
10.0%
5.7%
0.0%
0.0%
1.5%
98.5%
53.4%
9.9%
6.1%
0.0%
0.3%
1.5%
98.5%
50.9%
9.7%
6.6%
0.0%
0.0%
2.4%
97.6%
53.7%
9.7%
7.1%
0.0%
0.4%
2.3%
97.7%
Certain Characteristics
Purchase
Cash-out refinance
Other refinance 28.7%
24.7%
46.6%
31.8%
23.6%
44.6%
33.9%
20.1%
46.0%
36.4%
19.3%
44.3%
38.6%
21.5%
39.9%
40.3%
20.9%
38.8%
33.0%
18.4%
48.5%
35.2%
17.8%
47.0%
32.1%
19.2%
48.7%
35.0%
18.4%
46.6%
29.4%
21.6%
49.1%
33.4%
20.4%
46.3%
Loan Purpose
Percentage calculated based on unpaid principal balance of loans at time of acquisition. Single-family business acquisitions refer to single-family mortgage loans we acquire through purchase or securitization transactions.
Single-family business acquisitions for the applicable period excluding loans acquired under our Refi Plus initiative, which includes the Home Afordable Refinance Program ® (“HARP ®”). Our Refi Plus initiative provides expanded refinance
opportunities for eligible Fannie Mae borowers, and may involve the refinance of existing Fannie Mae loans with high loan-to-value ratios, including loans with loan-to-value ratios in excess of 100%.
FICO credit score is as of loan origination, as reported by the seler of the mortgage loan.
Newly originated Alt-A loans for the applicable periods consist of the refinance of existing loans under our Refi Plus initiative. For a description of our Alt-A loan classification criteria, refer to Fannie Mae’s 2016 Form 10-K.
(1)
(2)
(3)
(4)
Single-Family Acquisitions
5.4%
7.1%
23.0%
Single-Family Acquisitions
4.9%
6.9%
22.8%
Single-Family Acquisitions
California
Texas
Florida 6.0%
7.3%
20.3%
Single-Family Acquisitions
5.8%
7.6%
21.7%
Single-Family Acquisitions
4.6%
6.3%
23.7%
Single-Family Acquisitions
5.1%
6.9%
22.9%
© 2017 Fannie Mae. Trademarks of Fannie Mae. 6
Acquisition Period
(4)
(2) (2) (2) (2) (2) (2)
(3)
(1)
Top 3 Geographic Concentrations

Percentage calculated based on unpaid principal balance of loans at time of acquisition. Single-family business acquisitions refer to single-family mortgage loans we acquire through purchase or securitization
transactions.
FICO credit score is as of loan origination, as reported by the seler of the mortgage loan. FICO credit scores at origination below 620 primarily consist of the refinance of existing loans under our Refi Plus
initiative, which includes the Home Afordable Refinance Program (“HARP”). Our Refi Plus initiative provides expanded refinance opportunities for eligible Fannie Mae borowers, and may involve the refinance
of existing Fannie Mae loans with high loan-to-value ratios, including loans with loan-to-value ratios in excess of 100%.
Single-family business acquisitions for the applicable period excluding loans acquired under our Refi Plus initiative, which includes HARP.
<= 60%
60.01%
to 80%
80.01%
to 100% > 100% Total
>=740
660 to < 740
620 to < 660
< 620
Total 100.0%
0.4%
5.0%
35.2%
59.4%
0.3%
0.0%
0.0%
0.2%
0.1%
25.7%
0.1%
1.1%
10.3%
14.2%
52.3%
0.1%
2.8%
18.4%
30.9%
21.7%
0.1%
1.1%
6.3%
14.2%
<= 60%
60.01%
to 80%
80.01%
to 100% > 100% Total
>=740
660 to < 740
620 to < 660
< 620
Total 100.0%
0.5%
5.2%
34.4%
59.8%
0.6%
0.1%
0.1%
0.3%
0.2%
27.2%
0.1%
1.2%
10.6%
15.2%
53.5%
0.2%
2.8%
18.3%
32.1%
18.7%
0.1%
1.0%
5.2%
12.3%
<= 60%
60.01%
to 80%
80.01%
to 95% >95% Total
>=740
660 to < 740
620 to < 660
Total 100.0%
4.7%
34.9%
60.4%
3.3%
0.1%
1.6%
1.6%
22.6%
0.8%
8.8%
13.0%
53.0%
2.7%
18.6%
31.7%
21.1%
1.0%
6.0%
14.1%
<= 60%
60.01%
to 80%
80.01%
to 95% >95% Total
>=740
660 to < 740
620 to < 660
Total 100.0%
4.7%
34.1%
61.2%
1.8%
0.1%
0.9%
0.8%
25.5%
1.0%
9.7%
14.7%
54.6%
2.7%
18.6%
33.3%
18.1%
0.9%
4.9%
12.3%
Credit Profile for Single-Family Acquisitions (Excluding Refi Plus)
FIC
O
Cr
ed
it S
co
re
FIC
O
Cr
ed
it S
co
re
FIC
O
Cr
ed
it S
co
re
FIC
O
Cr
ed
it S
co
re
FIC
O
Cr
ed
it S
co
re
FIC
O
Cr
ed
it S
co
re
(1)
(2)
(3)
© 2017 Fannie Mae. Trademarks of Fannie Mae. 7
<= 60%
60.01%
to 80%
80.01%
to 95% >95% Total
>=740
660 to < 740
620 to < 660
Total 0.0%
0.0%
0.8%
-0.8%
1.5%
0.0%
0.7%
0.8%
-2.9%
-0.1%
-1.0%
-1.8%
-1.6%
0.0%
0.0%
-1.6%
3.0%
0.1%
1.0%
1.8%
<= 60%
60.01%
to 80%
80.01%
to 100% > 100% Total
>=740
660 to < 740
620 to < 660
<620
Total 0.0%
-0.2%
-0.2%
0.7%
-0.4%
-0.3%
0.0%
0.0%
-0.1%
-0.1%
-1.5%
-0.1%
-0.2%
-0.3%
-0.9%
-1.2%
-0.1%
-0.1%
0.1%
-1.2%
3.0%
0.0%
0.1%
1.1%
1.8%
Credit Profile for Single-Family Acquisitions
Credit Risk Profile Summary of Single-Family Business Acquisitions
For the Three
Months Ended
March 31, 2017
For the Three
Months Ended
March 31, 2017
For the Three
Months Ended
March 31, 2016
For the Three
Months Ended
March 31, 2016
Change in
Acquisitions
Profile
Change in
Acquisitions
Profile
Origination LTV Ratio Origination LTV Ratio Origination LTV Ratio
Origination LTV Ratio Origination LTV Ratio Origination LTV Ratio
(2) (2) (2)
(2) (2) (2)
(3)
(1)

2006 2007 2008 2009 2010 2011 2012 2013 2014 2015 2016 2017
40%
60%
80%
100%
Or
igin
ati
on
LT
V R
ati
o
0%
5%
10%
15%
20%
%
of
Sin
gle
-Fa
mi
ly B
us
ine
ss
Ac
qu
isit
ion
s
Origination Loan-to-Value (OLTV) Ratio
2006 2007 2008 2009 2010 2011 2012 2013 2014 2015 2016 2017
660
680
700
720
740
760
780
FIC
O
Cr
ed
it S
co
re
0%
5%
10%
15%
20%
%
of
Sin
gle
-Fa
mi
ly B
us
ine
ss
Ac
qu
isit
ion
s
FICO Credit Score
2006 2007 2008 2009 2010 2011 2012 2013 2014 2015 2016 2017
0%
20%
40%
60%
80%
100%
%
of
Sin
gle
-Fa
mi
ly B
us
ine
ss
Ac
qu
isit
ion
s
Share of Single-Family Business Acquisitions:
Fixed-rate Product
2006 2007 2008 2009 2010 2011 2012 2013 2014 2015 2016 2017
0%
20%
40%
60%
80%
100%
%
of
Sin
gle
-Fa
mi
ly B
us
ine
ss
Ac
qu
isit
ion
s
Share of Single-Family Business Acquisitions:
Loan Purpose - Purchase
Product Feature
Weighted Average Origination LTV Ratio Origination LTV > 90% Weighted Average FICO Credit Score FICO Credit Score < 620
Percentage calculated based on unpaid principal balance of loans at time of acquisition. Single-family business acquisitions refer to single-family mortgage loans we acquire through purchase or securitization
transactions.
FICO credit score is as of loan origination, as reported by the seler of the mortgage loan. Loans acquired after 2009 with FICO credit scores at origination below 620 primarily consist of the refinance of existing
loans under our Refi Plus initiative, which includes HARP.
Certain Credit Characteristics of Single-Family Business Acquisitions: 2006 - 2017
(1)
(2)
.
© 2017 Fannie Mae. Trademarks of Fannie Mae. 8
* Year-to-date through March 31, 2017.
(2)
(1)
**
* *

2010 2011 2012 2013 2014 2015 2016 2017
0%
20%
40%
60%
80%
100%
%
of
Sin
gle
-Fa
mi
ly B
us
ine
ss
Ac
qu
isit
ion
s
1%1%2%
3%3%4%6%
14%16%10%10%
6%
9%9%14%14%
51%52%48%36%
48%
55%52%54%
45%44%45%52%
30%
21%24%23%
Single-Family Business Acquisitions by Loan Purpose
HARP Refi Plus Acquisitions (Excluding HARP) Refinance Acquisitions (Excluding Refi Plus) Purchase Acquisitions
2010
HARP
Refi Plus
(Excl.
HARP)
2011
HARP
Refi Plus
(Excl.
HARP)
2012
HARP
Refi Plus
(Excl.
HARP)
2013
HARP
Refi Plus
(Excl.
HARP)
2014
HARP
Refi Plus
(Excl.
HARP)
2015
HARP
Refi Plus
(Excl.
HARP)
2016
HARP
Refi Plus
(Excl.
HARP)
2017
HARP
Refi Plus
(Excl.
HARP)
Unpaid Principal Balance (UPB) ($B)
Weighted Average Origination Note Rate 4.68%
$80.5
5.00%
$59.0
4.44%
$81.2
4.78%
$55.6
3.89%
$73.8
4.14%
$129.9
3.80%
$64.4
4.04%
$99.5
4.39%
$23.5
4.62%
$21.5
4.08%
$19.2
4.23%
$11.2
3.89%
$14.7
4.05%
$7.4
4.00%
$3.6
4.17%
$1.5
Credit Characteristics of Single-Family Business Acquisitions Under the Refi Plus Initiative
Our Refi Plus initiative, which started in April 2009, includes the Home Afordable Refinance Program (“HARP”). Our Refi Plus initiative provides expanded refinance opportunities for eligible Fannie Mae
borowers, and may involve the refinance of existing Fannie Mae loans with high loan-to-value ratios, including loans with loan-to-value ratios in excess of 100%.
FICO credit score is as of loan origination, as reported by the seler of the mortgage loan.
© 2017 Fannie Mae. Trademarks of Fannie Mae. 9
<=80%
80.01% to 105%
105.01% to 125%
>125%
Weighted Average Origination LTV Ratio 62.3%
0.0%
0.0%
0.0%
100.0%
92.2%
0.0%
5.6%
94.4%
0.0%
60.2%
0.0%
0.0%
0.0%
100.0%
94.3%
0.0%
11.9%
88.1%
0.0%
61.1%
0.0%
0.0%
0.0%
100.0%
111.0%
20.7%
22.1%
57.2%
0.0%
60.2%
0.0%
0.0%
0.0%
100.0%
109.8%
20.1%
21.5%
58.4%
0.0%
61.3%
0.0%
0.0%
0.0%
100.0%
101.5%
9.9%
16.9%
73.3%
0.0%
60.4%
0.0%
0.0%
0.0%
100.0%
98.4%
7.0%
15.0%
78.0%
0.0%
60.0%
0.0%
0.0%
0.0%
100.0%
96.9%
5.4%
13.5%
81.1%
0.0%
58.6%
0.0%
0.0%
0.0%
100.0%
96.3%
4.9%
12.8%
82.4%
0.0%
Origination LTV Ratio
< 620
620 to < 660
660 to < 740
>=740
Weighted Average FICO Credit Score 760
72.3%
23.9%
2.4%
1.4%
746
61.2%
33.1%
3.6%
2.0%
758
70.0%
25.6%
2.8%
1.7%
746
61.5%
32.6%
3.8%
2.1%
753
66.9%
26.0%
4.2%
2.9%
738
56.6%
33.8%
6.0%
3.7%
737
55.8%
31.9%
6.9%
5.3%
722
45.1%
38.7%
9.5%
6.7%
717
43.0%
36.5%
11.2%
9.3%
704
33.9%
41.0%
14.5%
10.6%
722
46.3%
34.4%
10.5%
8.8%
706
34.8%
41.1%
14.6%
9.5%
717
41.6%
37.5%
11.6%
9.2%
703
30.8%
44.9%
15.3%
9.1%
715
40.3%
38.8%
11.8%
9.1%
703
30.0%
46.6%
15.1%
8.3%
FICO Credit Scores
(1)
(2)
* Year-to-date through March 31, 2017.
Acquisition Year
(1)
(2)
*
*
Acquisitions

Overal Book
Origination Year
2017 2016 2015 2014 2013 2012 2011 2010 2009
2008 &
Earlier
Unpaid Principal Balance (UPB) ($B)
Share of Single-Family Conventional Guaranty Book
Average Unpaid Principal Balance
Serious Delinquency Rate
Weighted Average Origination LTV Ratio
Origination LTV Ratio > 90%
Weighted Average Mark-to-Market LTV Ratio
Mark-to-Market LTV Ratio > 100% and <= 125%
Mark-to-Market LTV Ratio > 125%
Weighted Average FICO Credit Score
FICO < 620
Interest Only
Negative Amortizing
Fixed-rate
Primary Residence
Condo/Co-op
Credit Enhanced
Cumulative Default Rate n/a
35.1%
9.3%
88.3%
94.4%
0.1%
1.6%
2.0%
745
0.4%
1.4%
59.7%
16.4%
74.8%
1.12%
$163,896
100.0%
$2,818.7
n/a
16.6%
9.3%
89.3%
70.0%
0.9%
11.7%
9.3%
699
2.1%
6.3%
61.8%
14.4%
75.2%
4.35%
$99,794
11.9%
$335.1
0.8%
3.9%
8.7%
90.5%
97.3%
0.0%
1.1%
0.9%
751
0.0%
0.3%
50.0%
6.4%
69.5%
0.94%
$136,342
3.4%
$94.6
0.6%
5.0%
8.1%
89.0%
96.5%
0.0%
0.9%
0.8%
756
0.0%
0.2%
48.1%
10.1%
71.0%
0.58%
$139,044
4.9%
$137.1
0.4%
7.1%
8.4%
86.9%
96.1%
0.0%
0.5%
0.8%
757
0.0%
0.1%
46.5%
12.3%
71.1%
0.45%
$140,157
5.9%
$167.3
0.4%
23.3%
8.7%
88.6%
98.0%
0.0%
0.3%
1.1%
759
0.3%
1.3%
50.6%
19.0%
76.5%
0.32%
$172,089
16.4%
$463.4
0.3%
46.2%
10.0%
85.9%
97.9%
0.0%
0.2%
1.8%
750
0.4%
1.6%
55.7%
20.6%
76.8%
0.41%
$169,515
14.3%
$403.1
0.1%
61.0%
9.8%
85.9%
96.0%
0.0%
0.0%
1.5%
742
0.2%
0.7%
63.1%
19.9%
76.9%
0.47%
$173,527
8.0%
$225.5
0.0%
64.8%
9.7%
88.1%
97.8%
0.0%
0.0%
0.6%
748
0.1%
0.4%
65.9%
16.7%
75.1%
0.21%
$202,357
13.2%
$371.6
0.0%
39.6%
9.5%
90.3%
98.7%
0.0%
0.0%
0.3%
750
0.0%
0.3%
70.1%
15.2%
73.6%
0.05%
$226,082
19.8%
$558.9
0.0%
28.2%
9.5%
87.9%
97.7%
0.0%
0.0%
0.4%
743
0.1%
0.3%
73.4%
15.0%
73.6%
0.00%
$215,483
2.2%
$62.3
Excludes non-Fannie Mae securities held in portfolio and those Alt-A and subprime wraps for which Fannie Mae does not have loan-level information. Fannie Mae had access to detailed loan-level information
for approximately 99% of its single-family conventional guaranty book of business as of March 31, 2017.
FICO credit score is as of loan origination, as reported by the seler of the mortgage loan. Loans acquired after 2009 with FICO credit scores at origination below 620 primarily consist of the refinance of existing
loans under our Refi Plus initiative, which includes HARP.
Percentage of loans in our single-family conventional guaranty book of business, measured by unpaid principal balance, included in an agreement used to reduce credit risk by requiring colateral, leters of
credit, mortgage insurance, corporate guarantees, inclusion in a credit risk transfer transaction reference pool, or other agreement that provides for our compensation to some degree in the event of a financial
loss relating to the loan. Because we include loans in reference pools for our Connecticut Avenue Securities™ and Credit Insurance Risk Transfer™ credit risk transfer transactions on a lagged basis (typicaly
about six months to one year after we initialy acquire the loans), we expect the percentage of our 2016 and 2017 single-family loan acquisitions with credit enhancement wil increase in the future.
Defaults include loan foreclosures, short sales, sales to third parties at the time of foreclosure and deeds-in-lieu of foreclosure. Cumulative Default Rate is the total number of single-family conventional loans in
the guaranty book of business originated in the identified year that have defaulted, divided by the total number of single-family conventional loans in the guaranty book of business originated in the identified
year. For 2008 and earlier cumulative default rates, refer to slide 18.
© 2017 Fannie Mae. Trademarks of Fannie Mae. 10
(1)
(2)
(3)
(4)
.
Credit Characteristics of Single-Family Conventional Guaranty Book of Business by Origination Year
(1)
(1)
(2)
(2)
(3)
(4)
As of March 31, 2017

Categories Not Mutualy Exclusive
Interest Only
Loans
Loans with
FICO < 620
Loans with FICO ≥
620 and < 660
Loans with
Origination LTV
Ratio > 90%
Loans with FICO
< 620 and
Origination LTV
Ratio > 90%
Alt-A Loans Refi PlusIncluding HARP
Unpaid Principal Balance (UPB) ($B)
Share of Single-Family Conventional Guaranty Book
Average Unpaid Principal Balance
Serious Delinquency Rate
Acquisition Years 2005-2008
Weighted Average Origination LTV Ratio
Origination LTV Ratio > 90%
Weighted Average Mark-to-Market LTV Ratio
Mark-to-Market LTV Ratio > 100% and <= 125%
Mark-to-Market LTV Ratio > 125%
Weighted Average FICO Credit Score
FICO < 620
Fixed-rate
Primary Residence
Condo/Co-op
Credit Enhanced 11.8%
9.3%
84.2%
99.0%
5.6%
732
1.0%
4.1%
61.7%
38.9%
86.3%
0.0%
0.77%
$144,542
14.9%
$419.6
9.6%
9.5%
77.0%
66.9%
3.2%
710
3.0%
8.9%
68.8%
17.0%
79.1%
57.2%
4.87%
$143,717
3.0%
$83.6
51.2%
5.9%
94.0%
89.8%
100.0%
582
6.6%
16.2%
87.1%
100.0%
108.7%
28.7%
7.84%
$130,605
0.6%
$16.8
68.4%
9.6%
93.5%
96.8%
3.7%
731
1.7%
5.6%
82.0%
100.0%
102.4%
7.4%
1.82%
$172,387
16.4%
$460.9
31.7%
6.0%
93.2%
89.2%
0.0%
642
1.5%
4.5%
66.1%
22.4%
78.7%
24.6%
3.87%
$136,496
5.3%
$149.5
21.3%
4.7%
94.2%
85.0%
100.0%
583
2.7%
7.3%
68.0%
30.6%
82.0%
38.7%
6.63%
$115,757
2.0%
$55.0
13.4%
14.3%
85.9%
24.6%
1.7%
721
3.9%
12.0%
75.3%
8.5%
74.4%
82.1%
6.30%
$224,709
1.6%
$44.4
Loans with multiple product features are included in al applicable categories. The subtotal is calculated by counting a loan only once even if it is included in multiple categories.
FICO credit score is as of loan origination, as reported by the seler of the mortgage loan.
For a description of our Alt-A loan classification criteria, refer to Fannie Mae’s 2016 Form 10-K.
Our Refi Plus initiative, which started in April 2009, includes the Home Afordable Refinance Program (“HARP”). Our Refi Plus initiative provides expanded refinance opportunities for eligible Fannie Mae
borowers, and may involve the refinance of existing Fannie Mae loans with high loan-to-value ratios, including loans with loan-to-value ratios in excess of 100%.
Excludes non-Fannie Mae securities held in portfolio and those Alt-A and subprime wraps for which Fannie Mae does not have loan-level information. Fannie Mae had access to detailed loan-level information
for approximately 99% of its single-family conventional guaranty book of business as of March 31, 2017.
Percentage of loans in our single-family conventional guaranty book of business, measured by unpaid principal balance, included in an agreement used to reduce credit risk by requiring colateral, leters of
credit, mortgage insurance, corporate guarantees, inclusion in a credit risk transfer transaction reference pool, or other agreement that provides for our compensation to some degree in the event of a financial
loss relating to the loan.
© 2017 Fannie Mae. Trademarks of Fannie Mae. 11
Subtotal of
Certain Product
Features
38.9%
8.7%
90.4%
91.6%
6.1%
718
1.1%
3.8%
69.0%
50.7%
86.1%
14.5%
2.15%
$150,601
32.2%
$908.2
Credit Characteristics of Single-Family Conventional Guaranty Book of Business by Certain Product Features
(1)
(2)
(3)
(4)
(5)
(6)
.
(1)
(2) (3)
(2)
(2)
(4)
(5)
(5)
(6)
As of March 31, 2017 (2)
(2)
(1)

Midwest
Northeast
Southeast
Southwest
West 11.5%
7.1%
25.5%
37.4%
18.5%
880
660
880
1,452
604
3,329
3,762
9,330
9,960
8,170
1,460
1,916
4,421
3,445
3,486
859
1,588
3,424
2,713
2,602
0.58%
0.76%
1.30%
2.07%
1.03%
11.0%
12.8%
27.5%
31.4%
17.3%
1.0%
0.7%
2.7%
2.5%
2.1%
52.7%
60.3%
63.5%
60.9%
64.9%
28.1%
17.0%
22.1%
18.1%
14.8%
$791.0
$480.3
$621.5
$509.9
$416.0
Regions
Based on the unpaid principal balance (UPB) of the single-family conventional guaranty book of business as of March 31, 2017. Excludes non-Fannie Mae securities held in portfolio and those Alt-A and
subprime wraps for which Fannie Mae does not have loan-level information. Fannie Mae had access to detailed loan-level information for approximately 99% of its single-family conventional guaranty book of
business as of March 31, 2017.
“Seriously delinquent loans” refers to single-family conventional loans that are 90 days or more past due or in the foreclosure process. “Seriously delinquent loan share” refers to the percentage of our single-
family seriously delinquent loan population in the applicable state or region. “Serious delinquency rate” refers to the number of single-family conventional loans that were seriously delinquent in the applicable
state or region, divided by the number of loans in our single-family conventional guaranty book of business in that state or region.
Measured from the borowers’ last paid instalment on their mortgages to when the related properties were added to our REO inventory for foreclosures completed during the first three months of 2017. Home
Equity Conversion Mortgages (HECMs) insured by HUD are excluded from this calculation.
Expressed as a percentage of credit losses for the single-family guaranty book of business. Credit losses consist of (a) charge-ofs, net of recoveries and (b) foreclosed property expense (income), adjusted to
exclude the impact of fair value losses resulting from credit-impaired loans acquired from MBS trusts. For information on total credit losses, refer to Fannie Mae’s 2017 Q1 Form 10-Q.
Select states represent the top ten states in UPB of the single-family conventional guaranty book of business as of March 31, 2017.
For information on which states are included in each region, refer to the single-family mortgage credit risk management discussion in Fannie Mae’s 2017 Q1 Form 10-Q.
© 2017 Fannie Mae. Trademarks of Fannie Mae. 12
Credit Characteristics of Single-Family Conventional Guaranty Book of Business and Single-Family Real Estate
Owned (REO) in Select States
SF Conventional Guaranty Book of Business
as of March 31, 2017
Seriously Delinquent Loans
as of March 31, 2017 Real Estate Owned (REO) Credit Loss
(1)
(2)
(3)
(4)
(5)
(6)
Al States 100.0%92434,55114,72811,1861.12%100.0%1.8%59.7%100.0%$2,818.7
Unpaid Principal
Balance (UPB)
($B)
Share of
Single-Family
Conventional
Guaranty Book
Weighted
Average
Mark-to-Market
LTV Ratio
Mark-to-Market
LTV >100%
Seriously
Delinquent Loan
Share
Serious
Delinquency
Rate
Q1 2017
Acquisitions
(# of properties)
Q1 2017
Dispositions
(# of properties)
REO Ending
Inventory
as of 3/31/17
Average Days to
Foreclosure
% of 2017 Credit
Losses
California
Texas
Florida
New York
Ilinois
New Jersey
Washington
Virginia
Pennsylvania
Massachusets 1.8%
4.7%
1.5%
0.8%
12.4%
8.6%
11.8%
12.5%
1.0%
7.4%
1,362
904
620
1,024
1,833
755
1,859
1,331
631
669
914
1,595
806
546
3,309
2,497
2,003
3,287
844
1,329
315
634
357
298
1,119
1,066
677
1,814
383
630
177
563
278
145
883
695
480
1,335
347
384
1.32%
1.58%
0.75%
0.65%
2.85%
1.39%
2.48%
1.73%
0.66%
0.47%
2.8%
5.0%
2.0%
1.8%
7.9%
5.4%
9.9%
9.8%
4.0%
5.7%
0.6%
1.5%
1.6%
0.3%
4.7%
5.0%
2.1%
5.6%
0.0%
0.9%
57.0%
64.2%
63.0%
55.8%
64.8%
67.1%
55.5%
63.8%
58.8%
50.4%
2.9%
3.0%
3.5%
3.6%
3.8%
3.8%
5.2%
5.6%
6.1%
19.6%
$82.3
$84.1
$97.9
$100.9
$106.0
$108.4
$146.8
$158.2
$171.9
$553.0
(1) (2)
(3) (4)
(6)
Select States(5) (2) (2)
Total

Based on states with the largest volume of seriously delinquent loans in our single-family conventional guaranty book of business as of March 31, 2017.
“Seriously delinquent loan share” refers to the percentage of our single-family seriously delinquent loan population in the applicable state.
Share of REO ending inventory calculated as the number of properties in the single-family REO ending inventory for the state divided by the total number of single-family properties in the REO ending inventory
for the specified time period.
2014
Q4
2015
Q1
2015
Q2
2015
Q3
2015
Q4
2016
Q1
2016
Q2
2016
Q3
2016
Q4
2017
Q1
0K
40K
80K
120K
160K
200K
240K
280K
320K
360K
SD
Q
Vo
lum
e
0%
5%
10%
15%
20%
25%
193K
330K
9.9%
9.8%
5.7%
10.3%
9.9%
7.9%
5.6%
5.4%
15.1%
5.2%
Seriously Delinquent Loan Share by Select States
California
Florida
Ilinois
New Jersey
New York
SDQ Volume
2014
Q4
2015
Q1
2015
Q2
2015
Q3
2015
Q4
2016
Q1
2016
Q2
2016
Q3
2016
Q4
2017
Q1
0K
20K
40K
60K
80K
100K
RE
O
En
din
g I
nv
en
tor
y
0%
5%
10%
15%
20%
25%
35K
87K
5.8%
7.2%
2.3%
3.5%
9.6%
10.5%
21.8%
9.5%
4.1%
3.8%
REO Ending Inventory Share by Select States
California
Florida
Ilinois
New Jersey
New York
REO Ending Inventory
(1)
(2)
(3)
.
Seriously Delinquent Loan and REO Ending Inventory Share by Select States
© 2017 Fannie Mae. Trademarks of Fannie Mae. 13
(1)
(2) (3)

Single-Family Short Sales and REO Sales Prices to Unpaid Principal Balance (UPB) of Mortgage Loans
2014
Q4
2015
Q1
2015
Q2
2015
Q3
2015
Q4
2016
Q1
2016
Q2
2016
Q3
2016
Q4
2017
Q1
60%
70%
80%
90%
68.6% 69.8%
72.4% 72.6% 73.1%
75.0% 73.9% 73.6%72.5% 74.1%
75.2% 76.3%
79.3% 79.9%
81.9% 80.9% 80.3%79.3% 79.7% 80.9%
REO Direct Sale Dispositions: Sales Prices to UPB
Net Sales Prices to UPB Trends for Top 10 States
REO Gross Sales/UPB REO Net Sales/UPB
2014
Q4
2015
Q1
2015
Q2
2015
Q3
2015
Q4
2016
Q1
2016
Q2
2016
Q3
2016
Q4
2017
Q1
60%
70%
80%
90%
72.2% 72.6% 73.8% 73.5% 73.3%
74.6% 73.7%73.6% 74.1% 74.1%
80.4% 80.7% 82.0% 81.7%
83.2% 82.4%82.0% 82.4% 82.5%82.7%
Short Sales: Sales Prices to UPB
Q1 2016 Q2 2016 Q3 2016 Q4 2016 Q1 2017
Florida
New Jersey
Ilinois
Ohio
New York
Michigan
Pennsylvania
California
Maryland
Missouri 71.6%
70.4%
88.3%
60.6%
62.4%
68.3%
58.6%
64.7%
63.9%
80.5%
64.3%
70.4%
87.2%
64.9%
60.9%
66.9%
58.1%
63.3%
63.0%
79.7%
64.4%
69.3%
88.1%
65.0%
62.7%
68.2%
59.2%
64.3%
59.9%
80.1%
67.6%
73.8%
86.6%
66.6%
65.7%
64.5%
62.4%
63.2%
61.0%
79.5%
64.0%
71.4%
82.6%
61.0%
66.0%
61.4%
62.6%
63.9%
59.6%
78.3%
Q1 2016 Q2 2016 Q3 2016 Q4 2016 Q1 2017
Florida
Ilinois
New Jersey
California
New York
Maryland
Nevada
Arizona
Pennsylvania
Virginia 79.5%
72.5%
80.3%
70.7%
70.0%
74.7%
81.9%
62.5%
70.6%
74.3%
78.2%
73.7%
79.4%
73.3%
73.0%
74.8%
81.4%
65.1%
69.1%
73.4%
78.6%
75.3%
79.0%
74.3%
70.8%
72.9%
80.8%
65.8%
70.9%
73.1%
80.3%
73.6%
79.1%
74.4%
70.8%
71.6%
81.2%
64.9%
65.8%
71.8%
77.5%
75.1%
74.8%
71.2%
71.2%
72.1%
79.4%
66.0%
66.1%
73.9%
Short Sales Gross Sales/UPB Short Sales Net Sales/UPB
Includes REO properties that have been sold to a third party (excluding properties that have been repurchased by the seler/servicer, acquired by a mortgage insurance company, or redeemed by a borower).
Sales Prices to UPB are calculated as the sum of sales proceeds received divided by the aggregate unpaid principal balance (UPB) of the related loans. Gross sales price represents the contract sale price. Net
sales price represents the contract sale price less charges/credits paid by or due to the seler or other parties at closing.
The states shown had the greatest volume of properties sold in the first three months of 2017 in each respective category.
© 2017 Fannie Mae. Trademarks of Fannie Mae. 14
(1)
(2)
(3)
(1) (2) (2)
(2)(3)
REO Net Sales
Prices to UPB
Short Sales
Net Sales
Prices to UPB

Foreclosure Alternatives
Consists of (a) modifications, which do not include trial modifications, loans to certain borowers who have received bankruptcy relief that are accounted for as troubled debt restructurings, or repayment plans
or forbearances that have been initiated but not completed and (b) repayment plans and forbearances completed.
Consists of (a) short sales, in which the borower, working with the servicer and Fannie Mae, sels the home prior to foreclosure for less than the amount owed to pay of the loan, accrued interest and other
expenses from the sale proceeds and (b) deeds-in-lieu of foreclosure, which involve the borower’s voluntarily signing over title to the property.
2014
Q4
2015
Q1
2015
Q2
2015
Q3
2015
Q4
2016
Q1
2016
Q2
2016
Q3
2016
Q4
2017
Q1
0K
5K
10K
15K
20K
25K
30K
35K
# o
f L
oa
ns
2K
2K 2K 2K 2K 2K 2K 1K 1K 1K4K 4K 4K 4K 3K 3K 3K 3K 2K 2K
7K
6K 6K 6K 5K 5K 4K 4K 4K 3K
© 2017 Fannie Mae. Trademarks of Fannie Mae. 15
Short Sales
Deeds-in-Lieu
2014
Q4
2015
Q1
2015
Q2
2015
Q3
2015
Q4
2016
Q1
2016
Q2
2016
Q3
2016
Q4
2017
Q1
0K
5K
10K
15K
20K
25K
30K
35K
# o
f L
oa
ns
20K
17K
21K21K21K19K
22K
26K27K26K
2K
2K
2K2K1K
1K
1K
2K2K2K
28K 29K 28K
24K
20K
22K 23K 22K
19K
22K
Modifications
Repayment Plans and Forbearances Completed
(1)
(2)
.
Home Retention Solutions
Single-Family Loan Workouts
(1) (2)

Modifications reflect permanent modifications which does not include loans curently in trial modifications.
Defined as total number of completed modifications for the time periods noted.
2014 Q2 2014 Q3 2014 Q4 2015 Q1 2015 Q2 2015 Q3 2015 Q4 2016 Q1 2016 Q2 2016 Q3 2016 Q4
Modifications 17,32520,80221,27820,89919,09922,19926,21426,70025,90828,86132,010
Re-performance Rates of Modified Single-Family Loans
© 2017 Fannie Mae. Trademarks of Fannie Mae. 16
(1)
(2)
3 Months Post Modification
6 Months Post Modification
9 Months Post Modification
12 Months Post Modification
15 Months Post Modification
18 Months Post Modification
21 Months Post Modification
24 Months Post Modification n/a
n/a
n/a
n/a
n/a
n/a
n/a
77%
n/a
n/a
n/a
n/a
n/a
n/a
69%
75%
n/a
n/a
n/a
n/a
n/a
67%
68%
77%
n/a
n/a
n/a
n/a
66%
65%
70%
79%
n/a
n/a
n/a
64%
64%
67%
72%
78%
n/a
n/a
63%
62%
64%
67%
69%
76%
n/a
65%
64%
64%
67%
67%
69%
77%
67%
65%
65%
66%
67%
68%
72%
79%
67%
66%
67%
66%
67%
70%
74%
80%
68%
68%
67%
67%
69%
71%
74%
79%
69%
68%
66%
67%
70%
71%
72%
79%
% Current or Paid Of
(1)
(2)

Based on the unpaid principal balance (UPB) of the single-family conventional guaranty book of business as of December 31 for the time periods noted, with the exception of 2017 which is as of March 31.
Based on the single-family credit losses for the year ended December 31 for the time periods noted, with the exception of 2017 which is as of March 31. Credit losses consist of (a) charge-ofs, net of recoveries and (b) fore-
closed property expense (income), adjusted to exclude the impact of fair value losses resulting from credit-impaired loans acquired from MBS trusts. Does not reflect the impact of recoveries that have not been alocated to spe-
cific loans. Negative values are the result of recoveries on previously recognized credit losses. Beginning in 2015, includes the impact of credit losses associated with our redesignation from held for investment to held for sale of
certain nonperforming single-family loans expected to be sold in the foreseeable future. Also, 2015 credit losses include the impact of our approach to adopting the charge-of provisions of the Federal Housing Finance Agency’s
Advisory Buletin AB 2012-02, “Framework for Adversely Classifying Loans, Other Real Estate Owned, and Other Assets and Listing Assets for Special Mention” on January 1, 2015.
Loans with multiple product features are included in al applicable categories. Categories are not mutualy exclusive.
FICO credit score is as of loan origination, as reported by the seler of the mortgage loan.
Newly originated Alt-A loans acquired after 2008 consist of the refinance of existing loans under our Refi Plus Initiative. For a description of our Alt-A loan classification criteria, refer to Fannie Mae’s 2016 Form 10-K.
For a description of our subprime loan classification criteria, refer to Fannie Mae’s 2016 Form 10-K.
Select states represent the top ten states with the highest percentage of single-family credit losses for the three months ended March 31, 2017.
© 2017 Fannie Mae. Trademarks of Fannie Mae. 17
Credit Loss Concentration of Single-Family Conventional Guaranty Book of Business
(1)
(2)
(3)
(4)
(5)
(6)
(7)
Florida
New Jersey
New York
Ilinois
California
Pennsylvania
Maryland
Ohio
Connecticut
Nevada
Al Other States 50.6%
1.0%
1.4%
2.2%
2.8%
3.1%
19.0%
4.2%
5.6%
4.0%
6.0%
50.8%
1.0%
1.4%
2.1%
2.8%
3.1%
19.6%
4.1%
5.6%
4.0%
5.7%
51.0%
1.0%
1.3%
2.1%
2.7%
3.0%
19.6%
4.1%
5.5%
4.0%
5.6%
51.4%
1.0%
1.3%
2.0%
2.7%
3.0%
19.7%
4.0%
5.4%
3.9%
5.6%
51.9%
1.0%
1.3%
2.0%
2.7%
3.0%
19.6%
3.9%
5.2%
3.8%
5.6%
52.0%
1.0%
1.3%
2.0%
2.7%
3.0%
19.6%
3.8%
5.2%
3.8%
5.6%
35.4%
4.8%
0.9%
3.3%
1.8%
1.6%
18.4%
9.6%
0.9%
2.0%
21.4%
32.1%
3.8%
1.4%
4.1%
3.1%
3.0%
5.1%
12.9%
1.9%
3.7%
28.9%
26.7%
1.4%
2.8%
4.2%
5.9%
4.2%
-0.8%
10.9%
4.8%
7.2%
32.6%
18.6%
1.8%
2.3%
2.2%
3.8%
3.4%
1.4%
7.8%
16.4%
21.6%
20.8%
29.5%
1.2%
2.7%
4.3%
3.9%
5.0%
2.1%
8.7%
18.3%
16.5%
7.9%
29.6%
2.2%
2.9%
3.6%
4.2%
4.7%
7.4%
8.6%
11.8%
12.4%
12.5%
Select State
% of Single-Family Conventional Guaranty Book of Business
2017 2016 2015 2014 2013 2012
% of Single-Family Credit Losses
2017 2016 2015 2014 2013 2012
Negative Amortizing
Interest Only
FICO < 620
FICO 620 to < 660
Origination LTV Ratio > 90%
FICO < 620 and Origination LTV Ratio > 90%
Alt-A
Subprime
Refi Plus including HARP 16.5%
0.2%
5.6%
0.7%
12.8%
6.0%
2.9%
3.7%
0.3%
19.5%
0.1%
4.7%
0.7%
15.1%
5.5%
2.6%
2.9%
0.2%
19.1%
0.1%
4.2%
0.7%
15.9%
5.5%
2.5%
2.5%
0.2%
17.6%
0.1%
3.7%
0.7%
16.3%
5.5%
2.3%
2.1%
0.1%
15.4%
0.1%
3.1%
0.6%
16.4%
5.3%
2.0%
1.7%
0.1%
14.9%
0.1%
3.0%
0.6%
16.4%
5.3%
2.0%
1.6%
0.1%
3.5%
1.1%
23.7%
2.3%
16.8%
14.2%
7.8%
21.8%
0.5%
7.4%
-0.2%
26.0%
2.0%
20.8%
15.7%
7.0%
18.7%
0.8%
10.4%
1.3%
17.4%
2.9%
15.3%
17.6%
12.1%
10.2%
0.9%
7.8%
1.6%
29.3%
2.7%
16.4%
18.3%
11.1%
18.0%
1.2%
14.0%
1.3%
24.9%
3.9%
21.9%
21.3%
14.5%
12.2%
0.3%
15.0%
1.1%
18.5%
4.3%
25.3%
19.3%
13.3%
14.2%
0.2%
2009 - YTD 2017
2005 - 2008
2004 & Prior 13.1%
21.7%
65.3%
9.1%
14.7%
76.2%
7.3%
12.2%
80.5%
5.8%
10.1%
84.1%
4.5%
8.1%
87.4%
4.2%
7.7%
88.1%
13.1%
81.8%
5.1%
12.4%
77.6%
10.0%
12.0%
74.7%
13.3%
12.1%
77.6%
10.3%
16.4%
64.7%
19.0%
13.2%
65.4%
21.4%
Vintage
(1) (2)
(3)
(4)
(4)
(4)
(5)
(6)
(7)
Certain Product Features

© 2017 Fannie Mae. Trademarks of Fannie Mae. 18
Note: Defaults include loan foreclosures, short sales, sales to third parties at the time of foreclosure and deeds-in-lieu of foreclosure. Cumulative Default Rate is the total number of single-family conventional loans in
the guaranty book of business originated in the identified year that have defaulted, divided by the total number of single-family conventional loans in the guaranty book of business originated in the identified year.
Data as of March 31, 2017 is not necessarily indicative of the ultimate performance of the loans and performance is likely to change, perhaps materialy, in future periods.
Yr
1-Q
1
Yr
1-Q
2
Yr
1-Q
3
Yr
1-Q
4
Yr
2-Q
1
Yr
2-Q
2
Yr
2-Q
3
Yr
2-Q
4
Yr
3-Q
1
Yr
3-Q
2
Yr
3-Q
3
Yr
3-Q
4
Yr
4-Q
1
Yr
4-Q
2
Yr
4-Q
3
Yr
4-Q
4
Yr
5-Q
1
Yr
5-Q
2
Yr
5-Q
3
Yr
5-Q
4
Yr
6-Q
1
Yr
6-Q
2
Yr
6-Q
3
Yr
6-Q
4
Yr
7-Q
1
Yr
7-Q
2
Yr
7-Q
3
Yr
7-Q
4
Yr
8-Q
1
Yr
8-Q
2
Yr
8-Q
3
Yr
8-Q
4
Yr
9-Q
1
Yr
9-Q
2
Yr
9-Q
3
Yr
9-Q
4
Yr
10
-Q
1
Yr
10
-Q
2
Yr
10
-Q
3
Yr
10
-Q
4
Yr
11
-Q
1
Yr
11
-Q
2
Yr
11
-Q
3
Yr
11
-Q
4
0.0%
2.0%
4.0%
6.0%
8.0%
10.0%
12.0%
14.0%
16.0%
Cu
mu
lat
ive
De
fau
lt R
ate
2007
2006
2005
2008
2004
2003
2002
2010 2011 2009 2012 2013 20142015 2016 2017
2002
2003
2004
2005
2006
2007
2008
2009
2010
2011
2012
2013
2014
2015
2016
2017
Cumulative Default Rates of Single-Family Conventional Guaranty Book of Business by Origination Year
Time Since Beginning of Origination Year

Loan Count UPB ($B)
% of Multifamily
Guaranty Book of
Business
% DUS ® Loans % SeriouslyDelinquent
YTD 2017
Multifamily Credit
Losses ($M)
2016 Multifamily
Credit Losses ($M)
2015 Multifamily
Credit Losses ($M)
Total Multifamily Guaranty Book of Business ($56)($4)$00.05%97%100%$253.328,967
Multifamily Credit Profile by Loan Attributes
Loans maturing in 2017
Loans maturing in 2018
Loans maturing in 2019
Loans maturing in 2020
Loans maturing in 2021
Other maturities ($40)
$2
($1)
($2)
$0
($15)
($9)
$1
$5
$0
$4
($3)
$0
$0
$0
($1)
$1
$0
0.01%
0.01%
0.15%
0.31%
0.13%
0.28%
98%
97%
97%
98%
96%
68%
75%
7%
6%
6%
4%
2%
$190.0
$17.9
$15.2
$15.6
$10.4
$4.2
19,251
2,448
2,378
2,029
1,861
1,000
Maturity Dates
Less than or equal to 70%
Greater than 70% and less than or equal to 80%
Greater than 80% $2
($34)
($24)
$0
$3
($7)
$0
$1
$0
0.33%
0.03%
0.05%
93%
99%
95%
2%
44%
54%
$4.8
$111.0
$137.5
1,244
9,877
17,846
Origination LTV Ratio
Less than or equal to $750K
Greater than $750K and less than or equal to $3M
Greater than $3M and less than or equal to $5M
Greater than $5M and less than or equal to $25M
Greater than $25M ($15)
($60)
$9
$9
$1
$0
($15)
$6
$5
$0
$0
$0
$1
$0
$0
0.03%
0.04%
0.13%
0.20%
0.22%
98%
99%
93%
83%
23%
48%
40%
6%
5%
0%
$122.6
$102.3
$14.1
$13.1
$1.2
2,423
9,414
3,885
8,379
4,866
Loan Size Distribution
(1)
(2)
(3)
(4)
(5)
(6)
Represents the percentage of loans for a given category (row) comprised of DUS loans, measured by unpaid principal balance.
Multifamily loans are classified as seriously delinquent when payment is 60 days or more past due.
Dolar amount of multifamily credit-related losses/(gains) for the applicable period and category. Total credit losses for each period may not tie to sum of al categories due to rounding.
Weighted average origination loan-to-value ratio is 67% as of March 31, 2017.
Under the Delegated Underwriting and Servicing, or DUS, program, Fannie Mae acquires individual, newly originated mortgages from specialy approved DUS lenders using DUS underwriting standards and/or DUS loan documents. Because DUS
lenders generaly share the risk of loss with Fannie Mae, they are able to originate, underwrite, close and service most loans without our pre-review.
Multifamily loans with an original unpaid balance of up to $3 milion nationwide or up to $5 milion in high cost markets.
DUS - Smal Balance Loans
DUS - Non Smal Balance Loans
Total ($54)
($57)
$3
($3)
($6)
$2
$2
$2
$0
0.05%
0.04%
0.12%
100%
100%
100%
97%
92%
5%
$245.7
$232.1
$13.6
22,335
15,029
7,306
Delegated Underwriting and Servicing (DUS) Loans
Non-DUS - Smal Balance Loans
Non-DUS - Non Smal Balance Loans
Total ($2)
($5)
$2
($1)
($2)
$1
($1)
($1)
($1)
0.13%
0.00%
0.25%
0%
0%
0%
3%
1%
2%
$7.6
$3.6
$4.0
6,632
286
6,346
Non-Delegated Underwriting and Servicing (Non-DUS) Loans
Lender Risk-Sharing
No Recourse to the Lender ($32)
($24)
($14)
$10
($1)
$1
0.03%
0.05%
69%
99%
5%
95%
$13.2
$240.1
2,064
26,903
Lender Risk-Sharing
Fixed
Variable ($22)
($34)
$2
($6)
($1)
$1
0.01%
0.06%
97%
97%
19%
81%
$49.3
$204.0
6,791
22,176
Interest Rate Type
© 2017 Fannie Mae. Trademarks of Fannie Mae. 19
(1)
(3) (3)
(4)
(5)
(6)
(6)
(3)(2)
As of March 31, 2017

UPB ($B)
% of Multifamily
Guaranty Book of
Business
% DUS Loans % SeriouslyDelinquent
YTD 2017 Multifamily
Credit Losses ($M)
2016 Multifamily
Credit Losses ($M)
2015 Multifamily
Credit Losses ($M)
Total Multifamily Guaranty Book of Business ($56)($4)$00.05%97%100%$253.3
Multifamily Credit Profile by Loan Attributes (cont.)
California
Texas
New York
Florida
Washington $1
($3)
$1
($6)
$0
$0
$0
$0
($5)
$0
$0
$0
($1)
$0
$0
0.00%
0.00%
0.01%
0.16%
0.00%
99%
100%
84%
100%
96%
4%
7%
9%
12%
20%
$9.5
$18.1
$23.9
$30.4
$51.3
Select States
Privately Owned with Subsidy ($4)$2$10.05%96%13%$32.4
Targeted Afordable Segment
DUS: Bank (Direct, Owned Entity, or Subsidiary)
DUS: Non-Bank Financial Institution
Non-DUS: Bank (Direct, Owned Entity, or Subsidiary)
Non-DUS: Non-Bank Financial Institution
Non-DUS: Public Agency/Non Profit $0
$0
$0
($12)
($45)
$0
($2)
$0
($5)
$3
$0
($1)
$0
$2
($1)
0.00%
0.00%
0.14%
0.07%
0.01%
0%
0%
0%
100%
97%
0%
0%
1%
58%
40%
$0.1
$0.4
$3.8
$147.0
$102.0
DUS & Non-DUS Lenders/Servicers
Represents the percentage of loans for a given category (row) comprised of DUS loans, measured by unpaid principal balance.
Multifamily loans are classified as seriously delinquent when payment is 60 days or more past due.
Dolar amount of multifamily credit-related losses/(gains) for the applicable period and category. Total credit losses for each period wil not tie to sum of al categories due to rounding.
The Multifamily Afordable Business Channel focuses on financing properties that are under an agreement that provides long-term afordability, such as properties with rent subsidies or income restrictions.
See htps:/www.fanniemae.com/multifamily/products for definitions.
© 2017 Fannie Mae. Trademarks of Fannie Mae. 20
2017
2016
2015
2014
2013
2012
2011
2010
2009
2008
2007
Prior to 2007 ($24)
($17)
($20)
$4
($1)
$2
$0
$0
$0
$0
$0
$0
($7)
($3)
($1)
$0
$3
$0
$2
$0
$0
$0
$0
$0
$0
$0
$1
$0
$0
$0
$0
$0
$0
$0
$0
$0
0.09%
0.29%
0.20%
0.08%
0.15%
0.03%
0.16%
0.02%
0.00%
0.00%
0.00%
0.00%
95%
58%
94%
97%
96%
96%
97%
98%
99%
99%
99%
99%
6%
2%
3%
4%
4%
6%
10%
9%
10%
16%
22%
7%
$15.1
$5.7
$8.2
$10.6
$11.1
$15.9
$25.0
$23.0
$25.9
$40.5
$55.0
$17.3
By Acquisition Year
Midwest
Northeast
Southeast
Southwest
West ($31)
($11)
($19)
$4
$1
($7)
($7)
$6
$1
$3
$0
$1
$0
($1)
$0
0.00%
0.10%
0.04%
0.02%
0.13%
96%
100%
99%
90%
99%
28%
23%
25%
16%
9%
$69.9
$57.3
$63.9
$39.8
$22.4
Regions
Conventional/Co-op
Seniors Housing
Manufactured Housing
Student Housing ($7)
$0
$7
($56)
($5)
$0
$2
($1)
$0
$0
$0
$0
0.00%
0.00%
0.09%
0.05%
100%
100%
97%
97%
3%
3%
5%
89%
$7.6
$8.7
$12.4
$224.6
Asset Class
(1)
(2)
(3)
(4)
(5)
(2) (3) (3)
(4)
(3)(1)As of March 31, 2017
(5)

2007 2008 2009 2010 2011 2012 2013 2014 2015 2016 2017
0.00%
0.20%
0.40%
0.60%
0.80%
1.00%
1.20%
1.40%
1.60%
Se
rio
us
De
linq
ue
nc
y R
ate
0.09%
0.44%
0.55%
0.34%
0.15%
0.08%0.08%
1.36%
0.24%
1.20%
0.30%
0.71%
0.18%
0.56%
0.24% 0.21% 0.21%
0.63%
0.50%
0.10% 0.13%
0.59%
0.07%
0.07% 0.06%
0.05%0.05% 0.05%0.05% 0.05%0.04%
0.92%
0.39%
Multifamily Total Serious Delinquency Rate DUS Serious Delinquency Rate Non-DUS Serious Delinquency Rate
Serious Delinquency Rates of Multifamily Book of Business
Multifamily loans are classified as seriously delinquent when payment is 60 days or more past due. Serious delinquency rate represents the year-end percentage of unpaid principal balance that is seriously
delinquent as of December 31 for the time periods noted, with the exception of 2017 which is as of March 31.
Under the Delegated Underwriting and Servicing, or DUS, program, Fannie Mae acquires individual, newly originated mortgages from specialy approved DUS lenders using DUS underwriting standards and/or
DUS loan documents. Because DUS lenders generaly share the risk of loss with Fannie Mae, they are able to originate, underwrite, close and service most loans without our pre-review.
© 2017 Fannie Mae. Trademarks of Fannie Mae. 21
(1)
(2)
.
(1)
(2)

2002 2003 2004 2005 2006 2007 2008 2009 2010 2011 2012 2013 2014 2015 2016 2017
0
20
40
60
UP
B (
$B
)
$19
$33
$19
$24 $22
$46
$34
$19 $17
$24
$33
$29 $29
$42
$55
$17
DUS/Non-DUS Acquisition Unpaid Principal Balance ($B)
2002 2003 2004 2005 2006 2007 2008 2009 2010 2011 2012 2013 2014 2015 2016 2017
0.0%
0.5%
1.0%
1.5%
2.0%
Cr
ed
it L
os
s R
ate
0.2%
0.0%
0.1% 0.2%
0.0%
0.1%
0.4%
0.0%
0.3%
0.5%
0.0%
0.3%
0.9%
0.2%
0.7%
1.3%
0.9%
1.1%
0.8%
1.4%
1.0%
0.3%
0.1%
0.3%
0.1%
0.0%
0.1%
0.0% 0.0% 0.0% 0.0% 0.0% 0.0% 0.0%
DUS/Non-DUS Cumulative Credit Loss Rates through March 31, 2017
DUS Credit Loss Rate Non-DUS Credit Loss Rate Multifamily Total Credit Loss Rate
Cumulative Credit Loss Rates of Multifamily Guaranty Book of Business by Acquisition Year
DUS Non-DUS
* Year-to-date through March 31, 2017. Acquisition Year
Cumulative credit loss rate is the cumulative credit losses (gains) through March 31, 2017 on the multifamily loans that were acquired in the applicable period, as a percentage of the total acquired unpaid
principal balance of multifamily loans in the applicable period.
Acquisition unpaid principal balance represents the total Multifamily volume acquired through purchase or securitization transactions for the applicable period.
© 2017 Fannie Mae. Trademarks of Fannie Mae. 22
(1)
(2)
(1)
(2)
*
*