UNITED STATES
SECURITIES AND EXCHANGE COMMISSION
Washington, DC 20549
FORM 8-K
CURRENT REPORT
Pursuant to Section 13 or 15(d) of The Securities Exchange Act of 1934
Date of Report (Date of earliest event reported): April 30, 2025
Federal National Mortgage Association
(Exact name of registrant as specified in its charter)
Fannie Mae
| Federally chartered corporation | ||||||||||||||||||||||||||||||||
| (State or other jurisdiction of incorporation) | (Commission File Number) | (IRS Employer Identification No.) | (Address of principal executive offices, including zip code) | (Registrant’s telephone number, including area code) | ||||||||||||||||||||||||||||
Check the appropriate box below if the Form 8-K filing is intended to simultaneously satisfy the filing obligation of the registrant under any of the following provisions (see General Instruction A.2. below):
| Written communications pursuant to Rule 425 under the Securities Act (17 CFR 230.425) | |||||
| Soliciting material pursuant to Rule 14a-12 under the Exchange Act (17 CFR 240.14a-12) | |||||
| Pre-commencement communications pursuant to Rule 14d-2(b) under the Exchange Act (17 CFR 240.14d-2(b)) | |||||
| Pre-commencement communications pursuant to Rule 13e-4(c) under the Exchange Act (17 CFR 240.13e-4(c)) | |||||
Securities registered pursuant to Section 12(b) of the Act:
| Title of each class | Trading Symbol(s) | Name of each exchange on which registered | ||||||
| None | N/A | N/A | ||||||
Indicate by check mark whether the registrant is an emerging growth company as defined in Rule 405 of the Securities Act of 1933 (§230.405 of this chapter) or Rule 12b-2 of the Securities Exchange Act of 1934 (§240.12b-2 of this chapter).
| Emerging growth company | ||||||||
If an emerging growth company, indicate by check mark if the registrant has elected not to use the extended transition period for complying with any new or revised financial accounting standards provided pursuant to Section 13(a) of the Exchange Act. ☐
The information in this report, including information contained in the exhibits submitted with this report, shall not be deemed “filed” for purposes of Section 18 of the Securities Exchange Act of 1934, or otherwise subject to the liabilities of Section 18, nor shall it be deemed incorporated by reference into any disclosure document relating to Fannie Mae (formally known as the Federal National Mortgage Association), except to the extent, if any, expressly incorporated by specific reference in that document.
Item 2.02 Results of Operations and Financial Condition.
On April 30, 2025, Fannie Mae filed its quarterly report on Form 10-Q for the quarter ended March 31, 2025 and is issuing a press release reporting its financial results for the periods covered by the Form 10-Q. Copies of the press release and a financial supplement are furnished as Exhibits 99.1 and 99.2, respectively, to this report and are incorporated herein by reference. Copies may also be found on Fannie Mae’s website, www.fanniemae.com, in the “About Us” section under “Investor Relations/Quarterly and Annual Results.” Information appearing on the company’s website is not incorporated into this report.
Item 9.01 Financial Statements and Exhibits.
(d) Exhibits. The following exhibits are being submitted with this report:
| Exhibit Number | Description of Exhibit | |||||||
| 99.1 | ||||||||
| 99.2 | ||||||||
| 104 | Cover Page Interactive Data File (embedded within the Inline XBRL document) | |||||||
SIGNATURES
Pursuant to the requirements of the Securities Exchange Act of 1934, the registrant has duly caused this report to be signed on its behalf by the undersigned hereunto duly authorized.
| FEDERAL NATIONAL MORTGAGE ASSOCIATION | ||||||||
| By: | /s/ Chryssa C. Halley | |||||||
| Chryssa C. Halley | ||||||||
| Executive Vice President and Chief Financial Officer | ||||||||
Date: April 30, 2025

Contact: Pete Bakel Resource Center: 1-800-232-6643
202-752-2034 Exhibit 99.1
Date: April 30, 2025
Fannie Mae Reports Net Income of $3.7 Billion for First Quarter 2025
| • | $3.7 billion first quarter 2025 net income, with net worth reaching $98.3 billion as of March 31, 2025 | "Our current focus at Fannie Mae is on operational efficiency and ensuring that Fannie Mae is a world-class operator. While assets are significant, there remains great opportunity to trim fat, turn the business around, generate more earnings, and do so all while ensuring safety and soundness. A profitable Fannie Mae, one with a strong balance sheet and strong capital, focused on delighting customers, means a safe and sound U.S. mortgage market. The operational improvements we are driving at Fannie Mae will turn around the company and will make Fannie Mae a great American icon once again." William J. Pulte, Director U.S. Federal Housing (FHFA) and Chairman, Fannie Mae Board of Directors “Fannie Mae earned $3.7 billion in net income in the first quarter of 2025, primarily driven by guaranty fees. We grew our net worth to $98 billion, continued to build our regulatory capital, and delivered on our mission. This quarter, we provided $76 billion of liquidity to America's housing market, helping 287,000 households buy, refinance, or rent a home. This included 74,000 first-time homebuyers. We remain focused on supporting housing affordability and stability and being a reliable source of liquidity." Priscilla Almodovar, President and Chief Executive Officer | |||||||||
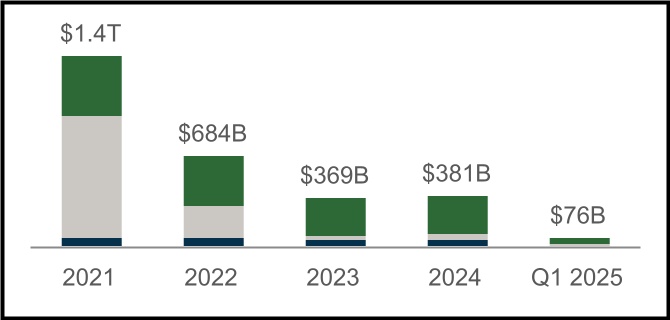
| • | $76 billion in liquidity provided in the first quarter of 2025, which enabled the financing of approximately 287,000 home purchases, refinancings, and rental units | ||||||||||
| • | Acquired approximately 144,000 single-family purchase loans, of which approximately half were for first-time homebuyers, and approximately 50,000 single-family refinance loans during the first quarter of 2025 | ||||||||||
| • | Financed approximately 93,000 units of multifamily rental housing in the first quarter of 2025; a significant majority were affordable to households earning at or below 120% of area median income, providing support for both workforce and affordable housing | ||||||||||
| • | Home prices grew by an estimated 1.4% on a national basis in the first quarter of 2025, according to the Fannie Mae Home Price Index | ||||||||||
| • | The U.S. weekly average 30-year fixed-rate mortgage rate decreased from 6.85% as of the end of 2024 to 6.65% as of the end of the first quarter of 2025 | ||||||||||
Q1 2025 Key Results | |||||||||||||||||||||||||||||||||||
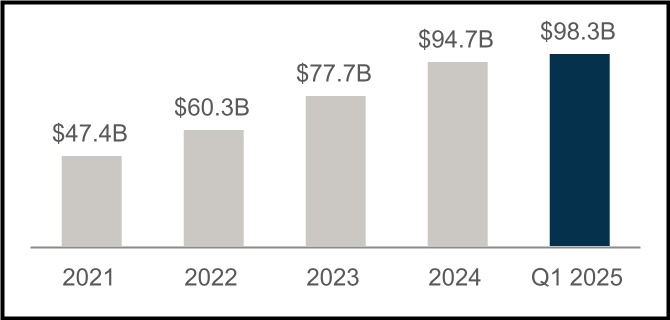
$98.3 Billion Net Worth | $76 Billion Supporting Housing Activity | ||||||||||||||||||||||||||||||||||
Increase of $3.7 billion in the first quarter of 2025 | SF Home Purchases | SF Refinancings | MF Rental Units | ||||||||||||||||||||||||||||||||
$3.7 Billion Net Income for Q1 2025 | Serious Delinquency Rates | |||||||||||||||||||
Decrease of $659 million compared with first quarter 2024 | Single-Family SDQ Rate | Multifamily SDQ Rate | ||||||||||||||||||

First Quarter 2025 Results | 1 | |||||||
| Summary of Financial Results | |||||||||||||||||||||||||||||||||||||||||||||||
| (Dollars in millions) | Q125 | Q424 | Variance | % Change | Q124 | Variance | % Change | ||||||||||||||||||||||||||||||||||||||||
| Net interest income | $ | 7,001 | $ | 7,182 | $ | (181) | (3) | % | $ | 7,023 | $ | (22) | — | %* | |||||||||||||||||||||||||||||||||
| Fee and other income | 84 | 115 | (31) | (27) | % | 72 | 12 | 17 | % | ||||||||||||||||||||||||||||||||||||||
| Net revenues | 7,085 | 7,297 | (212) | (3) | % | 7,095 | (10) | — | %* | ||||||||||||||||||||||||||||||||||||||
| (Provision) benefit for credit losses | (24) | (321) | 297 | 93 | % | 180 | (204) | NM | |||||||||||||||||||||||||||||||||||||||
| Fair value gains (losses), net | 123 | 842 | (719) | (85) | % | 480 | (357) | (74) | % | ||||||||||||||||||||||||||||||||||||||
| Investment gains (losses), net | — | (10) | 10 | 100 | % | 22 | (22) | (100) | % | ||||||||||||||||||||||||||||||||||||||
| Non-interest expense: | |||||||||||||||||||||||||||||||||||||||||||||||
Administrative expenses(1) | (992) | (947) | (45) | (5) | % | (889) | (103) | (12) | % | ||||||||||||||||||||||||||||||||||||||
Legislative assessments(2) | (931) | (949) | 18 | 2 | % | (930) | (1) | — | %* | ||||||||||||||||||||||||||||||||||||||
Credit enhancement expense(3) | (479) | (406) | (73) | (18) | % | (419) | (60) | (14) | % | ||||||||||||||||||||||||||||||||||||||
Other income (expense), net(4) | (198) | (327) | 129 | 39 | % | (106) | (92) | (87) | % | ||||||||||||||||||||||||||||||||||||||
| Total non-interest expense | (2,600) | (2,629) | 29 | 1 | % | (2,344) | (256) | (11) | % | ||||||||||||||||||||||||||||||||||||||
| Income before federal income taxes | 4,584 | 5,179 | (595) | (11) | % | 5,433 | (849) | (16) | % | ||||||||||||||||||||||||||||||||||||||
| Provision for federal income taxes | (923) | (1,049) | 126 | 12 | % | (1,113) | 190 | 17 | % | ||||||||||||||||||||||||||||||||||||||
| Net income | $ | 3,661 | $ | 4,130 | $ | (469) | (11) | % | $ | 4,320 | $ | (659) | (15) | % | |||||||||||||||||||||||||||||||||
| Total comprehensive income | $ | 3,655 | $ | 4,127 | $ | (472) | (11) | % | $ | 4,324 | $ | (669) | (15) | % | |||||||||||||||||||||||||||||||||
| Net worth | $ | 98,312 | $ | 94,657 | $ | 3,655 | 4 | % | $ | 82,006 | $ | 16,306 | 20 | % | |||||||||||||||||||||||||||||||||
| NM - Not meaningful | |||||||||||||||||||||||||||||||||||||||||||||||
| * Represents less than 0.5% | |||||||||||||||||||||||||||||||||||||||||||||||
(1) Consists of salaries and employee benefits and professional services, technology, and occupancy expenses. | |||||||||||||||||||||||||||||||||||||||||||||||
(2) Consists of TCCA fees, affordable housing allocations, and FHFA assessments. | |||||||||||||||||||||||||||||||||||||||||||||||
(3) Consists of costs associated with freestanding credit enhancements, which primarily include the company’s Connecticut Avenue Securities® (“CAS”) and Credit Insurance Risk TransferTM programs, enterprise-paid mortgage insurance, and certain lender risk-sharing programs. | |||||||||||||||||||||||||||||||||||||||||||||||
(4) Primarily consists of foreclosed property income (expense), change in the expected benefits from our freestanding credit enhancements, and gains and losses from partnership investments. | |||||||||||||||||||||||||||||||||||||||||||||||
Key Highlights | |||||
| • | Net income of $3.7 billion in the first quarter of 2025 was driven by strong revenues, bringing the company’s net worth to $98.3 billion as of March 31, 2025. •$7.1 billion of revenues in the first quarter of 2025 primarily driven by guaranty fees on the company’s $4.1 trillion guaranty book of business: •$5.9 billion of single-family revenues generated from a $3.6 trillion conventional guaranty book with an average charged guaranty fee of 48.1 basis points. As of March 31, 2025, 76% of the underlying mortgages in the single-family guaranty conventional book were below a 5% interest rate. •$1.2 billion of multifamily revenues generated from a $504.5 billion guaranty book with an average charged guaranty fee of 74.1 basis points. | ||||
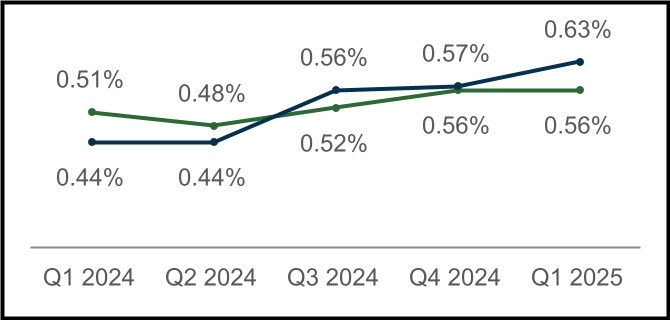
| • | Key credit characteristics of the company’s guaranty book of business as of March 31, 2025: •Single-family conventional guaranty book had a weighted-average mark-to-market loan-to-value ratio of 50%, a weighted-average FICO credit score at origination of 753, and a serious delinquency rate of 0.56%. •Multifamily guaranty book had a weighted-average original loan-to-value ratio of 63%, a weighted-average debt service coverage ratio of 2.0, and a serious delinquency rate of 0.63%. | ||||
| • | Credit enhancements as of March 31, 2025: •47% of the company’s single-family guaranty book was covered by one or more forms of credit enhancement, including 21% covered by mortgage insurance, which generally has a first loss position. •Approximately 99% of the company’s multifamily guaranty book was subject to lender loss-sharing agreements, and 33% was covered by a multifamily credit risk transfer transaction. | ||||
First Quarter 2025 Results | 2 | |||||||
| Single-Family Business Financial Results | |||||||||||||||||||||||||||||||||||||||||||||||
| (Dollars in millions) | Q125 | Q424 | Variance | % Change | Q124 | Variance | % Change | ||||||||||||||||||||||||||||||||||||||||
| Net interest income | $ | 5,866 | $ | 6,029 | $ | (163) | (3) | % | $ | 5,874 | $ | (8) | — | %* | |||||||||||||||||||||||||||||||||
| Fee and other income | 65 | 91 | (26) | (29) | % | 55 | 10 | 18 | % | ||||||||||||||||||||||||||||||||||||||
| Net revenues | 5,931 | 6,120 | (189) | (3) | % | 5,929 | 2 | — | %* | ||||||||||||||||||||||||||||||||||||||
| (Provision) benefit for credit losses | (24) | (396) | 372 | 94 | % | 335 | (359) | NM | |||||||||||||||||||||||||||||||||||||||
| Fair value gains (losses), net | 82 | 815 | (733) | (90) | % | 484 | (402) | (83) | % | ||||||||||||||||||||||||||||||||||||||
| Investment gains (losses), net | 2 | (5) | 7 | NM | 13 | (11) | (85) | % | |||||||||||||||||||||||||||||||||||||||
| Non-interest expense: | |||||||||||||||||||||||||||||||||||||||||||||||
| Administrative expenses | (812) | (776) | (36) | (5) | % | (743) | (69) | (9) | % | ||||||||||||||||||||||||||||||||||||||
| Legislative assessments | (920) | (934) | 14 | 1 | % | (920) | — | — | %* | ||||||||||||||||||||||||||||||||||||||
| Credit enhancement expense | (407) | (327) | (80) | (24) | % | (353) | (54) | (15) | % | ||||||||||||||||||||||||||||||||||||||
| Other income (expense), net | (174) | (172) | (2) | (1) | % | (192) | 18 | 9 | % | ||||||||||||||||||||||||||||||||||||||
| Total non-interest expense | (2,313) | (2,209) | (104) | (5) | % | (2,208) | (105) | (5) | % | ||||||||||||||||||||||||||||||||||||||
| Income before federal income taxes | 3,678 | 4,325 | (647) | (15) | % | 4,553 | (875) | (19) | % | ||||||||||||||||||||||||||||||||||||||
| Provision for federal income taxes | (760) | (871) | 111 | 13 | % | (946) | 186 | 20 | % | ||||||||||||||||||||||||||||||||||||||
| Net income | $ | 2,918 | $ | 3,454 | $ | (536) | (16) | % | $ | 3,607 | $ | (689) | (19) | % | |||||||||||||||||||||||||||||||||
| Average charged guaranty fee on new conventional acquisitions, net of TCCA fees | 56.5 bps | 56.3 bps | 0.2 bps | — | %* | 54.8 bps | 1.7 bps | 3 | % | ||||||||||||||||||||||||||||||||||||||
| Average charged guaranty fee on conventional guaranty book of business, net of TCCA fees | 48.1 bps | 47.9 bps | 0.2 bps | — | %* | 47.4 bps | 0.7 bps | 1 | % | ||||||||||||||||||||||||||||||||||||||
| NM - Not meaningful | |||||||||||||||||||||||||||||||||||||||||||||||
| * Represents less than 0.5% | |||||||||||||||||||||||||||||||||||||||||||||||
Single-Family Key Business Highlights | |||||
| • | Single-family conventional acquisition volume was $64.3 billion in the first quarter of 2025, compared with $62.3 billion in the first quarter of 2024. Purchase acquisition volume, of which approximately half was for first-time homebuyers, decreased to $50.1 billion in the first quarter of 2025 from $53.0 billion in the first quarter of 2024. Refinance acquisition volume was $14.2 billion in the first quarter of 2025, an increase from $9.3 billion in the first quarter of 2024. | ||||
| • | The average single-family conventional guaranty book of business decreased by $21.3 billion compared with the first quarter of 2024, to $3.6 trillion in the first quarter of 2025. The overall credit characteristics of the single-family conventional guaranty book of business remained strong, with a weighted-average mark-to-market loan-to-value ratio of 50% and a weighted-average FICO credit score at origination of 753 as of March 31, 2025. | ||||
| • | The average charged guaranty fee, net of TCCA fees, on the single-family conventional guaranty book increased to 48.1 basis points in the first quarter of 2025, compared with 47.4 basis points in the first quarter of 2024. The average charged guaranty fee on newly acquired single-family conventional loans, net of TCCA fees, increased to 56.5 basis points in the first quarter of 2025, compared with 54.8 basis points in the first quarter of 2024, primarily as a result of higher base guaranty fees charged on new acquisitions. | ||||
| • | The single-family serious delinquency rate remained flat at 0.56% as of March 31, 2025 compared to December 31, 2024. Single-family seriously delinquent loans are loans that are 90 days or more past due or in the foreclosure process. | ||||
First Quarter 2025 Results | 3 | |||||||
Multifamily Business Financial Results | |||||||||||||||||||||||||||||||||||||||||||||||
| (Dollars in millions) | Q125 | Q424 | Variance | % Change | Q124 | Variance | % Change | ||||||||||||||||||||||||||||||||||||||||
| Net interest income | $ | 1,135 | $ | 1,153 | $ | (18) | (2) | % | $ | 1,149 | $ | (14) | (1) | % | |||||||||||||||||||||||||||||||||
| Fee and other income | 19 | 24 | (5) | (21) | % | 17 | 2 | 12 | % | ||||||||||||||||||||||||||||||||||||||
| Net revenues | 1,154 | 1,177 | (23) | (2) | % | 1,166 | (12) | (1) | % | ||||||||||||||||||||||||||||||||||||||
| (Provision) benefit for credit losses | — | 75 | (75) | (100) | % | (155) | 155 | 100 | % | ||||||||||||||||||||||||||||||||||||||
| Fair value gains (losses), net | 41 | 27 | 14 | 52 | % | (4) | 45 | NM | |||||||||||||||||||||||||||||||||||||||
| Investment gains (losses), net | (2) | (5) | 3 | 60 | % | 9 | (11) | NM | |||||||||||||||||||||||||||||||||||||||
| Non-interest expense: | |||||||||||||||||||||||||||||||||||||||||||||||
| Administrative expenses | (180) | (171) | (9) | (5) | % | (146) | (34) | (23) | % | ||||||||||||||||||||||||||||||||||||||
| Legislative assessments | (11) | (15) | 4 | 27 | % | (10) | (1) | (10) | % | ||||||||||||||||||||||||||||||||||||||
| Credit enhancement expense | (72) | (79) | 7 | 9 | % | (66) | (6) | (9) | % | ||||||||||||||||||||||||||||||||||||||
| Other income (expense), net | (24) | (155) | 131 | 85 | % | 86 | (110) | NM | |||||||||||||||||||||||||||||||||||||||
| Total non-interest expense | (287) | (420) | 133 | 32 | % | (136) | (151) | (111) | % | ||||||||||||||||||||||||||||||||||||||
| Income before federal income taxes | 906 | 854 | 52 | 6 | % | 880 | 26 | 3 | % | ||||||||||||||||||||||||||||||||||||||
| Provision for federal income taxes | (163) | (178) | 15 | 8 | % | (167) | 4 | 2 | % | ||||||||||||||||||||||||||||||||||||||
| Net income | $ | 743 | $ | 676 | $ | 67 | 10 | % | $ | 713 | $ | 30 | 4 | % | |||||||||||||||||||||||||||||||||
| Average charged guaranty fee rate on multifamily guaranty book of business, at period end | 74.1 bps | 74.4 bps | (0.3) bps | — | %* | 75.8 bps | (1.7) bps | (2) | % | ||||||||||||||||||||||||||||||||||||||
| NM - Not meaningful | |||||||||||||||||||||||||||||||||||||||||||||||
| * Represents less than 0.5% | |||||||||||||||||||||||||||||||||||||||||||||||
Multifamily Key Business Highlights | |||||
| • | New multifamily business volume was $11.8 billion in the first quarter of 2025, compared with $10.1 billion in the first quarter of 2024. | ||||
| • | The multifamily guaranty book of business grew to $504.5 billion as of March 31, 2025, a 5.8% increase from March 31, 2024. | ||||
| • | The average charged guaranty fee on the multifamily guaranty book of business decreased by 1.7 basis points compared with March 31, 2024, to 74.1 basis points as of March 31, 2025. | ||||
| • | The multifamily serious delinquency rate increased to 0.63% as of March 31, 2025 from 0.57% as of December 31, 2024. Multifamily seriously delinquent loans are loans that are 60 days or more past due. | ||||
First Quarter 2025 Results | 4 | |||||||
| Additional Matters | ||
Fannie Mae’s Condensed Consolidated Balance Sheets and Condensed Consolidated Statements of Operations and Comprehensive Income for the first quarter of 2025 are available in the accompanying Annex; however, investors and interested parties should read the company’s quarterly report on Form 10-Q for the period ended March 31, 2025 (“First Quarter 2025 Form 10-Q”), which was filed today with the Securities and Exchange Commission and is available on Fannie Mae’s website, www.fanniemae.com. The company provides further discussion of its financial results and condition, credit performance, and other matters in its First Quarter 2025 Form 10-Q. Additional information about the company’s financial and credit performance is contained in Fannie Mae’s “Financial Supplement Q1 2025” at www.fanniemae.com.
# # #
This release includes forward-looking statements regarding the company's future financial performance, as well as the company’s business plans and their impact. Actual outcomes could be materially different from what is set forth in these forward-looking statements due to a variety of factors, including those described in “Forward-Looking Statements” in the company’s First Quarter 2025 Form 10-Q and in “Forward-Looking Statements” and “Risk Factors” in the company’s annual report on Form 10-K for the year ended December 31, 2024 (“2024 Form 10-K”).
Fannie Mae provides website addresses in its news releases solely for readers’ information. Other content or information appearing on these websites is not part of this release.
To learn more, visit fanniemae.com.
First Quarter 2025 Results | 5 | |||||||
ANNEX
FANNIE MAE
(In conservatorship)
Condensed Consolidated Balance Sheets — (Unaudited)
(Dollars in millions)
| As of | |||||||||||||||||||||||
| March 31, 2025 | December 31, 2024 | ||||||||||||||||||||||
| ASSETS | |||||||||||||||||||||||
| Cash and cash equivalents | $ | 39,352 | $ | 38,853 | |||||||||||||||||||
| Restricted cash and cash equivalents (includes $31,138 and $31,893, respectively, related to consolidated trusts) | 38,445 | 39,958 | |||||||||||||||||||||
| Securities purchased under agreements to resell (includes $1,069 and $0 respectively, related to consolidated trusts) | 31,769 | 15,975 | |||||||||||||||||||||
| Investments in securities, at fair value | 79,347 | 79,197 | |||||||||||||||||||||
| Mortgage loans: | |||||||||||||||||||||||
| Loans held for sale, at lower of cost or fair value | 775 | 373 | |||||||||||||||||||||
| Loans held for investment, at amortized cost: | |||||||||||||||||||||||
| Of Fannie Mae | 47,425 | 50,053 | |||||||||||||||||||||
| Of consolidated trusts | 4,086,508 | 4,095,287 | |||||||||||||||||||||
| Total loans held for investment (includes $4,508 and $3,744, respectively, at fair value) | 4,133,933 | 4,145,340 | |||||||||||||||||||||
| Allowance for loan losses | (7,532) | (7,707) | |||||||||||||||||||||
| Total loans held for investment, net of allowance | 4,126,401 | 4,137,633 | |||||||||||||||||||||
| Total mortgage loans | 4,127,176 | 4,138,006 | |||||||||||||||||||||
| Advances to lenders | 1,848 | 1,825 | |||||||||||||||||||||
| Deferred tax assets, net | 10,453 | 10,545 | |||||||||||||||||||||
| Accrued interest receivable (includes $10,855 and $10,666, respectively, related to consolidated trusts) | 11,592 | 11,364 | |||||||||||||||||||||
| Other assets | 13,727 | 14,008 | |||||||||||||||||||||
| Total assets | $ | 4,353,709 | $ | 4,349,731 | |||||||||||||||||||
| LIABILITIES AND EQUITY | |||||||||||||||||||||||
| Liabilities: | |||||||||||||||||||||||
| Accrued interest payable (includes $11,025 and $10,858, respectively, related to consolidated trusts) | $ | 11,902 | $ | 11,585 | |||||||||||||||||||
| Debt: | |||||||||||||||||||||||
| Of Fannie Mae (includes $358 and $385, respectively, at fair value) | 136,818 | 139,422 | |||||||||||||||||||||
| Of consolidated trusts (includes $14,977 and $13,292, respectively, at fair value) | 4,091,840 | 4,088,675 | |||||||||||||||||||||
| Other liabilities (includes $1,677 and $1,699, respectively, related to consolidated trusts) | 14,837 | 15,392 | |||||||||||||||||||||
| Total liabilities | 4,255,397 | 4,255,074 | |||||||||||||||||||||
| Commitments and contingencies (Note 14) | — | — | |||||||||||||||||||||
| Fannie Mae stockholders’ equity: | |||||||||||||||||||||||
| Senior preferred stock (liquidation preference of $216,156 and $212,029, respectively) | 120,836 | 120,836 | |||||||||||||||||||||
| Preferred stock, 700,000,000 shares are authorized—555,374,922 shares issued and outstanding | 19,130 | 19,130 | |||||||||||||||||||||
| Common stock, no par value, no maximum authorization—1,308,762,703 shares issued and 1,158,087,567 shares outstanding | 687 | 687 | |||||||||||||||||||||
| Accumulated deficit | (34,964) | (38,625) | |||||||||||||||||||||
| Accumulated other comprehensive income | 23 | 29 | |||||||||||||||||||||
| Treasury stock, at cost, 150,675,136 shares | (7,400) | (7,400) | |||||||||||||||||||||
Total stockholders’ equity | 98,312 | 94,657 | |||||||||||||||||||||
| Total liabilities and equity | $ | 4,353,709 | $ | 4,349,731 | |||||||||||||||||||
See Notes to Condensed Consolidated Financial Statements in the First Quarter 2025 Form 10-Q
First Quarter 2025 Results | 6 | |||||||
FANNIE MAE
(In conservatorship)
Condensed Consolidated Statements of Operations and Comprehensive Income — (Unaudited)
(Dollars in millions, except per share amounts)
| For the Three Months Ended March 31, | |||||||||||||||||||||||
| 2025 | 2024 | ||||||||||||||||||||||
| Interest income: | |||||||||||||||||||||||
| Investments in securities | $ | 1,127 | $ | 921 | |||||||||||||||||||
| Mortgage loans | 37,399 | 35,216 | |||||||||||||||||||||
| Other | 490 | 661 | |||||||||||||||||||||
| Total interest income | 39,016 | 36,798 | |||||||||||||||||||||
| Interest expense: | |||||||||||||||||||||||
| Short-term debt | (105) | (195) | |||||||||||||||||||||
| Long-term debt | (31,910) | (29,580) | |||||||||||||||||||||
| Total interest expense | (32,015) | (29,775) | |||||||||||||||||||||
| Net interest income | 7,001 | 7,023 | |||||||||||||||||||||
| (Provision) benefit for credit losses | (24) | 180 | |||||||||||||||||||||
| Net interest income after (provision) benefit for credit losses | 6,977 | 7,203 | |||||||||||||||||||||
| Fair value gains (losses), net | 123 | 480 | |||||||||||||||||||||
| Fee and other income | 84 | 72 | |||||||||||||||||||||
| Investment gains (losses), net | — | 22 | |||||||||||||||||||||
| Non-interest income | 207 | 574 | |||||||||||||||||||||
| Non-interest expense: | |||||||||||||||||||||||
| Salaries and employee benefits | (611) | (511) | |||||||||||||||||||||
| Professional services, technology, and occupancy | (381) | (378) | |||||||||||||||||||||
| Legislative assessments | (931) | (930) | |||||||||||||||||||||
| Credit enhancement expense | (479) | (419) | |||||||||||||||||||||
| Other income (expense), net | (198) | (106) | |||||||||||||||||||||
| Total non-interest expense | (2,600) | (2,344) | |||||||||||||||||||||
| Income before federal income taxes | 4,584 | 5,433 | |||||||||||||||||||||
| Provision for federal income taxes | (923) | (1,113) | |||||||||||||||||||||
| Net income | 3,661 | 4,320 | |||||||||||||||||||||
| Other comprehensive income (loss) | (6) | 4 | |||||||||||||||||||||
| Total comprehensive income | $ | 3,655 | $ | 4,324 | |||||||||||||||||||
| Net income | $ | 3,661 | $ | 4,320 | |||||||||||||||||||
Dividends distributed or amounts attributable to senior preferred stock | (3,655) | (4,324) | |||||||||||||||||||||
| Net income (loss) attributable to common stockholders | $ | 6 | $ | (4) | |||||||||||||||||||
| Earnings per share: | |||||||||||||||||||||||
| Basic | $ | 0.00 | $ | 0.00 | |||||||||||||||||||
| Diluted | 0.00 | 0.00 | |||||||||||||||||||||
| Weighted-average common shares outstanding: | |||||||||||||||||||||||
| Basic | 5,867 | 5,867 | |||||||||||||||||||||
| Diluted | 5,893 | 5,867 | |||||||||||||||||||||
See Notes to Condensed Consolidated Financial Statements in the First Quarter 2025 Form 10-Q
First Quarter 2025 Results | 7 | |||||||

© 2025 Fannie Mae DRAFT Financial Supplement Q1 2025 April 30, 2025 EXHIBIT 99.2

Q1 2025 Financial Supplement 2© 2025 Fannie Mae DRAFT Quarterly Financial Supplement Page Overview 3 Single-Family Business 13 Multifamily Business 19 Definitions 23 Endnotes 24 Table of Contents Some of the terms and other information in this presentation are defined and discussed more fully in Fannie Mae's Form 10-Q for the quarter ended March 31, 2025 ("Q1 2025 Form 10-Q") and Form 10-K for the year ended December 31, 2024 ("2024 Form 10-K"). This presentation should be reviewed together with the Q1 2025 Form 10-Q and the 2024 Form 10-K, which are available at www.fanniemae.com in the "About Us—Investor Relations—SEC Filings" section. Information on or available through the company's website is not part of this supplement. Some of the information in this presentation is based upon information from third-party sources such as sellers and servicers of mortgage loans. Although Fannie Mae generally considers this information reliable, Fannie Mae does not independently verify all reported information. Due to rounding, amounts reported in this presentation may not sum to totals indicated (i.e., 100%), or amounts shown as 100% may not reflect the entire population. Unless otherwise indicated, data is as of March 31, 2025 or for the first quarter of 2025. Data for prior years is as of December 31 or for the full year indicated. Note references are to endnotes, appearing on pages 24 to 27.

Q1 2025 Financial Supplement | Overview 3© 2025 Fannie Mae DRAFTCorporate Highlights (Dollars in millions) Q1 2025 Q4 2024 Variance Q1 2024 Variance Net interest income $7,001 $7,182 $(181) $7,023 $(22) Fee and other income 84 115 (31) 72 12 Net revenues 7,085 7,297 (212) 7,095 (10) (Provision) benefit for credit losses (24) (321) 297 180 (204) Fair value gains (losses), net 123 842 (719) 480 (357) Investment gains (losses), net — (10) 10 22 (22) Non-interest expense: Administrative expenses(1) (992) (947) (45) (889) (103) Legislative assessments (931) (949) 18 (930) (1) Credit enhancement expense(2) (479) (406) (73) (419) (60) Other income (expense), net(3) (198) (327) 129 (106) (92) Total non-interest expense (2,600) (2,629) 29 (2,344) (256) Income before federal income taxes 4,584 5,179 (595) 5,433 (849) Provision for federal income taxes (923) (1,049) 126 (1,113) 190 Net income $3,661 $4,130 $(469) $4,320 $(659) Total comprehensive income $3,655 $4,127 $(472) $4,324 $(669) Net worth $98,312 $94,657 $3,655 $82,006 $16,306 Net worth ratio(4) 2.3 % 2.2 % 1.9 % Return on assets(5) 0.34 % 0.38 % 0.40 % Efficiency ratio(6) 36.1 % 32.3 % 30.9 % Summary of Q1 2025 Financial Results Q1 2025 Key Highlights In Q1 2025, we continued our unwavering focus on serving the U.S. mortgage market, improving our safety and soundness, and enhancing our financial position • Provided $76 billion of liquidity to the single- family and multifamily mortgage markets • Helped approximately 287,000 households buy, refinance, or rent a home • Earned $3.7 billion of net income and achieved our twenty-ninth consecutive quarter of positive earnings • Grew net worth and built available regulatory capital by $3.7 billion. Net worth reached $98.3 billion as of March 31, 2025 • Efficiency ratio of 36.1%, up from 30.9% in Q1 2024, primarily as a result of lower fair value gains and increased non-interest expense in Q1 2025 compared with Q1 2024 • Recognized $931 million in expenses we pay to Treasury, HUD and FHFA for TCCA fees, affordable housing funds and FHFA assessments • Ended Q1 2025 with a $4.1 trillion guaranty book of business and $4.4 trillion in assets • Our single-family conventional guaranty book of business is $3.6 trillion in size, 76% of the underlying mortgages are below a 5% interest rate, and the book has a weighted-average mark-to-market LTV ratio of 50%, a weighted average FICO credit score of 753(33) and a serious delinquency rate of 0.56% • Our multifamily guaranty book of business is $505 billion in size and has a weighted-average OLTV ratio of 63%, DSCR of 2.0 and a serious delinquency rate of 0.63%

Q1 2025 Financial Supplement | Overview 4© 2025 Fannie Mae DRAFTSelected Financial Data Selected Financial Data (as of applicable period end) (Dollars in millions) Q1 2025 Q4 2024 Q3 2024 Q2 2024 Q1 2024 Cash and cash equivalents $ 39,352 $ 38,853 $ 38,146 $ 41,911 $ 12,524 Securities purchased under agreements to resell 31,769 15,975 18,065 27,650 73,725 Investments in securities, at fair value 79,347 79,197 61,790 49,899 49,896 Mortgage loans, net of allowance for loan losses 4,127,176 4,138,006 4,138,658 4,129,214 4,129,118 Total assets $ 4,353,709 $ 4,349,731 $ 4,334,556 $ 4,323,893 $ 4,323,819 Debt of Fannie Mae 136,818 139,422 121,715 118,543 118,401 Debt of consolidated trusts 4,091,840 4,088,675 4,096,063 4,094,421 4,098,173 Total liabilities $ 4,255,397 $ 4,255,074 $ 4,244,026 $ 4,237,410 $ 4,241,813 Total Fannie Mae stockholders' equity $ 98,312 $ 94,657 $ 90,530 $ 86,483 $ 82,006 Allowance for credit losses(7) $ (7,554) $ (7,730) $ (7,676) $ (8,026) $ (8,379)

Q1 2025 Financial Supplement | Overview 5© 2025 Fannie Mae DRAFT State Growth Rate: 0.00% to 2.49% 2.50% to 4.99% 5.00% to 7.49% >7.50% Home Price Growth State One Year Home Price Growth Rate Q1 2025 Share of Single-Family Conventional Guaranty Book CA 5.2% 19% TX 0.9% 8% FL 0.4% 6% NY 8.6% 4% WA 5.4% 4% CO 3.1% 3% NJ 10.4% 3% IL 8.2% 3% VA 7.3% 3% NC 4.3% 3% 18.2% 7.7% 5.5% 5.3% 1.4% 2021 2022 2023 2024 Q1 2025 One Year Home Price Growth Rate Q1 2025(8) United States 5.2% Single-Family Home Price Growth Rate(8) Top 10 States by UPB(8)

Q1 2025 Financial Supplement | Overview 6© 2025 Fannie Mae DRAFT $3,896 $4,076 $4,107 $4,117 $4,107 $413 $441 $470 $500 $505 $3,483 $3,635 $3,637 $3,617 $3,602 2021 2022 2023 2024 Q1 2025 Market Liquidity and Guaranty Book of Business Highlights $904 $237 $451 $378 $273 $270 $69 $69 $1,424 $684 $369 $381 $76 2021 2022 2023 2024 Q1 2025 Single-Family Home Purchases (UBP) Single-Family Refinancings (UPB) Multifamily Rental Units (UPB) Mortgage Market Liquidity Provided Single-family conventional guaranty book of business(9) Multifamily guaranty book of business(10) • Acquired approximately 144,000 single-family purchase loans, of which approximately half were for first-time homebuyers, and approximately 50,000 single-family refinance loans during the first quarter of 2025. • Financed approximately 93,000 units of multifamily rental housing in the first quarter of 2025; a significant majority were affordable to households earning at or below 120% of area median income, providing support for both workforce and affordable housing. • As of December 31, 2024 (the latest date for which information is available), Fannie Mae owned or guaranteed an estimated 25% of single- family mortgage debt outstanding and an estimated 21% of multifamily mortgage debt outstanding in the United States. $50 $14 $12 144 50 93 # of Units (in thousands) Single-Family Home Purchases (UPB) Single-Family Refinancings (UPB) Multifamily Rental Units (UPB) (Dollars in billions) (Dollars in billions) (Dollars in billions) Q1 2025 Outstanding Guaranty Book of Business (UPB) at Period End Highlights

Q1 2025 Financial Supplement | Overview 7© 2025 Fannie Mae DRAFT Net Interest Margin (NIM) 67.6 67.1 63.5 63.6 62.3 67.8 72.9 69.3 66.9 66.9 64.8 42.0 44.0 45.4 45.8 46.4 47.8 49.3 49.7 50.2 50.8 51.3 40.0 41.5 42.1 42.7 43.4 44.4 45.7 46.2 46.9 47.6 48.1 69.4 74.9 78.7 75.4 71.8 74.5 78.4 78.5 76.1 74.4 74.1 2015 2016 2017 2018 2019 2020 2021 2022 2023 2024 Q1 2025 (In basis points) We Have Relatively Stable NIM, Primarily Driven by Guaranty Fees Net Interest Margin(11) Avg. Single-Family Guaranty Fee(12) Avg. Multifamily Guaranty Fee(13) Avg. Total Book Guaranty Fee(14)

Q1 2025 Financial Supplement | Overview 8© 2025 Fannie Mae DRAFTInterest Income and Liquidity Management Components of Net Interest Income Corporate Liquidity Portfolio Retained Mortgage Portfolio(19) Outstanding Debt of Fannie Mae(20) $29.6 $29.4 $28.8 $28.7 $7.0 $14.2 $16.1 $16.2 $16.5 $4.2 $3.1 $3.3 $3.4 $3.4 $11.2 $7.1 $4.0 $3.3 $1.1 $2.9 $5.2 $5.5 2021 2022 2023 2024 Q1 2025 Base guaranty fee income, net of TCCA(15) Net deferred guaranty fee income(16) Base guaranty fee income related to TCCA Net interest income from portfolios & hedge impact(17) $81.1 $76.9 $76.6 $89.9 $92.4 $23.0 $29.6 $33.7 $38.3 $33.4$14.3 $12.0 $11.4 $11.2 $11.0$118.4 $118.5 $121.7 $139.4 $136.8 Q1 2024 Q2 2024 Q3 2024 Q4 2024 Q1 2025 $12.5 $41.9 $38.1 $38.8 $39.3 $60.1 $27.7 $18.0 $16.0 $30.7 $47.6 $48.0 $60.1 $77.6 $77.9 $120.2 $117.6 $116.2 $132.4 $147.9 Q1 2024 Q2 2024 Q3 2024 Q4 2024 Q1 2025 Cash and cash equivalents(18) Securities purchased under agreements to resell U.S. Treasury securities $109.2 $77.7 $83.2 $94.9 $80.3 $50.7 $23.7 $34.9 $48.6 $32.4 $37.6 $38.5 $38.6 $40.2 $42.3 $20.9 $15.5 $9.7 $6.1 $5.6 2021 2022 2023 2024 Q1 2025 Lender liquidity Loss mitigation Other (Dollars in billions) (Dollars in billions) (Dollars in billions) (Dollars in billions) Long-term debt, excluding portion maturing within one year Long-term debt maturing within one year Short-term debt

Q1 2025 Financial Supplement | Overview 9© 2025 Fannie Mae DRAFT Select Credit Metrics 30-Days Past Due(21) Seriously Delinquent(21) Nonperforming Loans(22) 0.87% 0.99% 0.96% 1.00% 0.84% 0.06% 0.19% 0.12% 0.10% 0.17% 0.78% 0.90% 0.86% 0.89% 0.76% Q1 2024 Q2 2024 Q3 2024 Q4 2024 Q1 2025 0.52% 0.50% 0.60% 0.44% 0.44% 0.56% 0.57% 0.63% 0.51% 0.49% 0.54% 0.60% Q1 2024 Q2 2024 Q3 2024 Q4 2024 Q1 2025 0.73% 0.73% 0.79% 0.88% 0.84% 0.44% 0.44% 0.56% 0.57% 0.63% 0.70% 0.70% 0.76% 0.84% 0.81% Q1 2024 Q2 2024 Q3 2024 Q4 2024 Q1 2025 Net Charge-Offs(24) 0.01% 0.01% 0.02% 0.10% 0.02% 0.15% 0.09% 0.03% 0.02% 0.04% 0.03% Q1 2024 Q2 2024 Q3 2024 Q4 2024 Q1 2025 Allowance for Credit Losses / Guaranty Book(23) 0.17% 0.16% 0.14% 0.15% 0.14% 0.44% 0.49% 0.53% 0.48% 0.47% 0.20% 0.20% 0.19% 0.19% 0.18% Q1 2024 Q2 2024 Q3 2024 Q4 2024 Q1 2025 Total Guaranty Book 30-Days PD, NPL and NCO Declined, and SDQ Increased, in Q1 2025 Total Guaranty Book Single-Family Multifamily Total Guaranty Book Single-Family Multifamily Total Guaranty Book Single-Family Multifamily Total Guaranty Book Single-Family Multifamily Total Guaranty Book Single-Family Multifamily 0.59% 0.02%0.02%

Q1 2025 Financial Supplement | Overview 10© 2025 Fannie Mae DRAFTRegulatory Capital Rule and Illustrative Return on Required CET1 Total Risk-Based Regulatory Capital Ratio(25) Leverage Capital Ratio(25) Illustrative Return on Average Required CET1 14.0% 14.6% 10.5% 11.1% 1.5% 1.5% 2.0% 2.0% CET1 Additional Tier 1 Tier 2 3% 4% We have a regulatory capital rule that was issued and finalized by FHFA in 2020.(26) Prior to conservatorship, we only had statutory capital requirements. FHFA’s capital rule is similar to U.S. bank regulatory capital rules in that it establishes both risk-based and leverage minimum capital requirements, in addition to prescribed capital buffers. The Return on Average Required CET1 reflects our net income relative to our Common Equity Tier 1 (CET1) requirement, including buffers. Our net income reflects our current capitalization, in the respective periods, and does not include impacts of being fully capitalized. $139 $141 $141 $17.4 $17.0 $3.7 12.5% 12.0% 10.4% 2023 2024 Q1 2025 Tier 1 Leverage Ratio Fannie Mae U.S. G-SIB Banks(27) Fannie Mae U.S. G-SIB Banks(27) (Dollars in billions) Average CET1 Requirement Net Income Return on Average Required CET1(28)

Q1 2025 Financial Supplement | Overview 11© 2025 Fannie Mae DRAFTCommon Equity Tier 1 (CET1) Capital Requirement CET1 Capital Requirement (Including Buffers)(25) Fannie Mae CET1 Capital Overview • As of March 31, 2025, our CET1 capital requirement (including buffers) is 10.5% of our risk-weighted assets, equivalent to $140 billion. • Of the $140 billion, $60 billion represents our minimum capital requirement of 4.5% of our risk-weighted assets. • Similar to U.S. G-SIB Banks, we are required to hold additional CET1 capital buffer amounts above our 4.5% minimum. • Our buffers total $80 billion, or 57% of our total CET1 requirement: ◦ Stress Capital Buffer: currently set at 0.75% of our adjusted total assets. ◦ Stability Capital Buffer: determined by an annual calculation based on our market share of mortgage debt outstanding and our asset size. ▪ For each percentage of market share above 5%, the buffer increases by 5 basis points of our adjusted total assets ◦ Countercyclical Capital Buffer: currently set at 0.0% of our adjusted total assets. 10.5% 11.1% 4.5% 4.5% 2.5% 4.0% 3.5% 2.6% Minimum Requirement Stress Capital Buffer Stability Capital Buffer G-SIB Bank Surcharge $140B $47B $33B $60B Fannie Mae(25) U.S. G-SIB Banks(25)

Q1 2025 Financial Supplement | Overview 12© 2025 Fannie Mae DRAFTNet Worth and Regulatory Capital Deficit Growth in Net Worth(29) Progress Towards Regulatory Capital Requirements(26) $105 $107 $(74) $(33) +$41B $13.5 $84.8 $98.3 Net Worth 1/1/2020 Cumulative Net Income 2020 - Q1 2025 Net Worth 3/31/2025 We resumed retaining our earnings in 2019, resulting in $84.8 billion of net worth growth since January 2020. We have a deficit of regulatory capital today primarily because the stated value of the senior preferred stock does not qualify as regulatory capital.(30) Since January 2023, we have built $41 billion(31) of available regulatory capital. Minimum Capital Requirement: Total Risk- Based Capital(32) Available Capital / (Deficit) 12/31/2022 3/31/2025 $(179) $(140) Minimum Capital Shortfall (Dollars in billions) (Dollars in billions) We have materially grown our net worth and meaningfully reduced our regulatory capital deficit.

Q1 2025 Financial Supplement | Single-Family 13© 2025 Fannie Mae DRAFT Fannie Mae 24% Freddie Mac 29% Ginnie Mae 37% Private-label securities 10% $3,631 $3,625 $3,626 $3,622 $3,610 47.4 47.6 47.7 47.9 48.1 Q1 2024 Q2 2024 Q3 2024 Q4 2024 Q1 2025 $53 $75 $80 $62 $50 $9 $11 $13 $23 $14 54.8 51.9 54.1 56.3 56.5 $62 $86 $93 $85 $64 Q1 2024 Q2 2024 Q3 2024 Q4 2024 Q1 2025 Single-Family Highlights Q1 2025 $2,918M Net income $5,866M Net interest income $(24)M (Provision) benefit for credit losses $82M Fair value gains (losses), net Single-Family Select Financial Highlights Single-Family Conventional Guaranty Book of Business(9) Single-Family Conventional Loan Acquisitions(9) Q1 2025 Single-Family Mortgage-Related Securities Share of Issuances Purchase Refinance Average charged guaranty fee on new single-family conventional acquisitions, net of TCCA fees (bps)(12) Average single-family conventional guaranty book of business Average charged guaranty fee on single-family conventional guaranty book of business, net of TCCA fees (bps)(12) (Dollars in billions) (Dollars in billions) $69.0B $5,874 $6,096 $6,131 $6,029 $5,866 $335 $548 $451 $(396) Q1 2024 Q2 2024 Q3 2024 Q4 2024 Q1 2025 (Dollars in millions) Net interest income (Provision) benefit for credit losses $(24)

Q1 2025 Financial Supplement | Single-Family 14© 2025 Fannie Mae DRAFT 43% 13% 4% 8% 10% 33% 62% 86% 83% 78% 24% 25% 10% 9% 12% 2021 2022 2023 2024 Q1 2025 756 747 755 758 757 6.0% 8.0% 6.0% 5.0% 6.0% 2021 2022 2023 2024 Q1 2025 Credit Characteristics of Single-Family Conventional Loan Acquisitions Certain Credit Characteristics of Single-Family Conventional Loans by Acquisition Period Q1 2025 Acquisition Credit Profile by Certain Loan Features Categories are not mutually exclusive Q1 2024 Q2 2024 Q3 2024 Q4 2024 Full Year 2024 Q1 2025 OLTV Ratio > 95% Home- Ready®(35) FICO Credit Score < 680(33) DTI Ratio > 43%(34) Total UPB (Dollars in billions) $62.3 $85.9 $93.1 $84.7 $326.0 $64.3 $4.0 $4.1 $3.9 $24.6 Weighted-Average OLTV Ratio 78% 78% 77% 76% 77% 77% 97% 84% 69% 79% OLTV Ratio > 95% 7% 7% 7% 6% 7% 6% 100% 21% 1% 6% Weighted-Average FICO® Credit Score(33) 757 759 759 758 758 757 754 749 655 751 FICO Credit Score < 680(33) 5% 5% 5% 5% 5% 6% 1% 7% 100% 7% DTI Ratio > 43%(34) 37% 37% 37% 35% 36% 38% 40% 59% 43% 100% Fixed-rate 99% 99% 99% 100% 99% 99% 100% 100% 100% 99% Primary Residence 92% 93% 93% 94% 93% 94% 100% 100% 96% 95% HomeReady®(35) 6% 7% 7% 6% 7% 6% 21% 100% 7% 10% 69% 75% 78% 77% 77% 3.0% 5.0% 6.0% 7.0% 6.0% 2021 2022 2023 2024 Q1 2025 Original Loan-to-Value Ratio FICO Credit Score(33) Acquisitions by Loan Purpose Cash-out Refinance Purchase Other Refinance Weighted-Average OLTV Ratio % OLTV Ratio > 95% Weighted-Average FICO Credit Score % FICO Credit Score < 680

Q1 2025 Financial Supplement | Single-Family 15© 2025 Fannie Mae DRAFT 1.25% 0.65% 0.55% 0.56% 0.56% 2021 2022 2023 2024 Q1 2025 Certain Credit Characteristics of Single-Family Conventional Guaranty Book of Business by Origination Year and Loan Features(9)(36) As of March 31, 2025 Origination Year Certain Loan Features Categories are not mutually exclusive Overall Book / Total 2008 & Earlier 2009-2019 2020-2021 2022 2023 2024 2025 OLTV Ratio > 95% Home- Ready®(35) FICO Credit Score < 680(33) DTI Ratio > 43%(34) Total UPB (Dollars in billions) $3,602.5 $54.2 $730.1 $1,769.1 $447.1 $258.0 $306.4 $37.6 $183.4 $128.3 $264.5 $950.9 Average UPB $209,368 $73,889 $128,639 $242,197 $282,555 $304,910 $322,685 $327,358 $183,025 $183,375 $161,430 $236,957 Share of SF Conventional Guaranty Book 100% 2% 20% 49% 12% 7% 9% 1% 5% 4% 7% 27% Share of Loans with Credit Enhancement(37) 47% 8% 37% 42% 65% 78% 54% 37% 85% 78% 42% 53% Serious Delinquency Rate (by loan count)(38) 0.56% 1.70% 0.62% 0.37% 0.92% 0.56% 0.18% 0.00% 1.22% 1.02% 2.03% 0.86% Share of Seriously Delinquent Loan Population(39) 100% 13% 37% 28% 15% 5% 2% 0% 13% 7% 35% 36% Weighted-Average OLTV Ratio 73% 75% 75% 70% 76% 79% 77% 77% 101% 87% 74% 76% OLTV Ratio > 95% 5% 9% 8% 3% 6% 7% 7% 6% 100% 32% 6% 6% Weighted-Average Mark-to-Market LTV Ratio(40) 50% 27% 32% 47% 64% 71% 75% 77% 67% 64% 47% 55% Weighted-Average FICO Credit Score(33) 753 695 746 758 747 755 757 756 739 745 653 744 FICO Credit Score < 680(33) 7% 39% 11% 5% 9% 5% 5% 6% 9% 8% 100% 9% Weighted-Average Borrower Interest Rate 4.1% 5.6% 4.1% 3.0% 4.7% 6.6% 6.6% 6.7% 4.7% 4.5% 4.5% 4.4% Credit Characteristics of Single-Family Conventional Guaranty Book of Business 753 752 753 753 753 8.1% 9.0% 8.0% 7.0% 7.0% 2021 2022 2023 2024 Q1 2025 54% 52% 51% 50% 50% 0.0%* 0.1% 0.1% 0.1% 0.1% 2021 2022 2023 2024 Q1 2025 Mark-to-Market Loan-to-Value Ratio(40) FICO Credit Score(33) SDQ Rate(38) Weighted-Average MTMLTV % MTMLTV Ratio > 100% * Represents less than 0.05% of MTMLTV Ratio > 100% Weighted-Average FICO Credit Score % FICO Credit Score < 680 SDQ Rate (by loan count)

Q1 2025 Financial Supplement | Single-Family 16© 2025 Fannie Mae DRAFT Single-Family Credit Risk Transfer $1,328 $1,349 $1,346 $1,314 $1,314 $48 $47 $46 $45 $31 $420 $432 $425 $419 $421 $860 $870 $875 $850 $862 37% 37% 37% 36% 37% Q1 2024 Q2 2024 Q3 2024 Q4 2024 Q1 2025 (Dollars in billions) 2023 2024 Q1 2025 Credit Enhancement Outstanding UPB % of Book(44) Outstanding Outstanding UPB % of Book(44) Outstanding Outstanding UPB % of Book(44) Outstanding Primary mortgage insurance and other(41) $763 21% $761 21% $756 21% Connecticut Avenue Securities(42) 843 24 850 23 862 24 Credit Insurance Risk Transfer(43) 399 11 419 12 421 12 Other 52 1 45 1 31 1 Less: loans covered by multiple credit enhancements (411) (12) (408) (11) (385) (11) Total single-family loans with credit enhancement $1,646 45% $1,667 46% $1,685 47% Single-Family Guaranty Book of Business Covered by a CRT Transaction(43) Single-Family Loans with Credit Enhancement % Single-family conventional guaranty book of business in a CRT transaction Connecticut Avenue Securities (UPB outstanding) Credit Insurance Risk Transfer (UPB outstanding) Other (UPB outstanding) (Dollars in billions)

Q1 2025 Financial Supplement | Single-Family 17© 2025 Fannie Mae DRAFT $71.4 $35.3 $19.0 $21.7 $6.5 $8.4 $16.6 $7.3 $9.5 $62.1 $18.4 $11.2 $11.4 342.7 167.3 85.0 91.8 27.0 2021 2022 2023 2024 Q1 2025 Single-Family Problem Loan Statistics Single-Family Serious Delinquency Rate by State as of March 31, 2025(38) Top 10 States by UPB Single-Family Loan Workouts(46) Single-Family REO Ending Inventory Total Loan Workouts (In Thousands) Payment Deferrals Modifications Other(47) State SDQ Rate: Less than 0.50% 0.76% to 0.99% 0.50% to 0.75% 1.00% and above (Dollars in billions) State Serious Delinquency Rate(38) Average Months to Foreclosure(45) CA 0.43% 20 TX 0.69% 17 FL 0.96% 36 NY 0.77% 99 WA 0.39% 16 CO 0.40% 13 NJ 0.53% N/A IL 0.69% 23 VA 0.38% 18 NC 0.50% 24 7 9 8 6 5 2021 2022 2023 2024 Q1 2025 (Units in thousands)

Q1 2025 Financial Supplement | Single-Family 18© 2025 Fannie Mae DRAFT Time Since Beginning of Origination Year 2009 2010 2011 2012 2013 2014 2015 2016 2017 2018 2019 2020 2021 2022 2023 2024 2025 Yr1 Yr2 Yr3 Yr4 Yr5 Yr6 Yr7 Yr8 Yr9 Yr10 Yr11 Yr12 Yr13 Yr14 Yr 15 Yr 16 Yr 17 0.0% 0.2% 0.4% 0.6% 0.8% 1.0% Single-Family Cumulative Default Rates Cumulative Default Rates of Single-Family Conventional Guaranty Book of Business by Origination Year(48) * The chart excludes loans originated prior to 2009 as they represent only 2% of the single-family conventional guaranty book of business as of March 31, 2025. 2009 2010 2013 2012 2011 2014 2015

Q1 2025 Financial Supplement | Multifamily 19© 2025 Fannie Mae DRAFT $476.9 $480.1 $485.6 $499.7 $504.5 75.8 75.5 75.1 74.4 74.1 Q1 2024 Q2 2024 Q3 2024 Q4 2024 Q1 2025 $10.1 $9.3 $13.2 $22.5 $11.8 Q1 2024 Q2 2024 Q3 2024 Q4 2024 Q1 2025 Multifamily Highlights Q1 2025 $743M Net income $1,135M Net interest income $0M (Provision) benefit for credit losses $(24)M Other income (expense), net Multifamily Select Financial Highlights Multifamily New Business Volume Multifamily Guaranty Book of Business(10) Multifamily Credit Risk Transfer $100.3 $99.2 $102.9 $101.2 $111.2 $48.3 $48.2 $56.7 $56.1 $55.9 31% 31% 33% 31% 33% $148.6 $147.4 $159.6 $157.3 $167.1 Q1 2024 Q2 2024 Q3 2024 Q4 2024 Q1 2025 Average charged guaranty fee on multifamily guaranty book of business (in bps) at period end UPB outstanding of multifamily guaranty book of business at period end (Dollars in billions) (Dollars in billions) (Dollars in millions) UPB outstanding of multifamily loans in a Multifamily Connecticut Avenue SecuritiesTM transaction % Multifamily guaranty book in a Multifamily CRT transaction UPB outstanding of multifamily loans in a Multifamily CIRT transaction $1,149 $1,172 $1,144 $1,153 $1,135 $(155) $(248) $(424) $75 $0 Q1 2024 Q2 2024 Q3 2024 Q4 2024 Q1 2025 Net interest income (Provision) benefit for credit losses (Dollars in billions)

Q1 2025 Financial Supplement | Multifamily 20© 2025 Fannie Mae DRAFT 89% 78% 99% 100% 100% 11% 22% 2021 2022 2023 2024 Q1 2025 Credit Characteristics of Multifamily Loan Acquisitions Certain Credit Characteristics of Multifamily Loans by Acquisition Period Categories are not mutually exclusive 2021 2022 2023 2024 Q1 2025 Total UPB (Dollars in billions) $69.5 $69.2 $52.9 $55.1 $11.8 Weighted-Average OLTV Ratio 65% 59% 59% 62% 61% Loan Count 4,203 3,572 2,812 2,602 654 % Lender Recourse(49) 100% 100% 100% 99% 100% % DUS(50) 99% 99% 99% 99% 99% % Full Interest-Only 40% 53% 63% 61% 54% Weighted-Average OLTV Ratio on Full Interest-Only Acquisitions 59% 56% 57% 59% 58% Weighted-Average OLTV Ratio on Non-Full Interest-Only Acquisitions 68% 63% 63% 66% 65% % Partial Interest-Only(51) 50% 39% 32% 31% 39% 27% 14% 6% 11% 11% 72% 86% 93% 89% 88% 2021 2022 2023 2024 Q1 2025 $0.6B $0.6B $0.4B $0.4B$0.3B $0.5B $0.3B $0.3B $0.3B $0.3B Share of Acquisitions: 33.9% Total Top 10 UPB: $4.0B Original Loan-to-Value Ratio Top 10 MSAs by Q1 2025 Acquisition UPB Acquisitions by Note Type % OLTV ratio less than or equal to 70% % OLTV ratio greater than 70% and less than or equal to 80% % OLTV ratio greater than 80% Fixed-rate Variable-rateDallas Chicago Minneapolis New York Seattle Denver Washington DC Los Angeles San Diego Philadelphia

Q1 2025 Financial Supplement | Multifamily 21© 2025 Fannie Mae DRAFT $10.3B $29.6B $30.2B $54.5B $210.0B $131.0B $38.9B Certain Credit Characteristics of Multifamily Guaranty Book of Business by Acquisition Year, Asset Class, or Targeted Affordable Segment(10) As of March 31, 2025 Acquisition Year Asset Class or Targeted Affordable Segment Categories are not mutually exclusive Overall Book 2016 & Earlier 2017-2020 2021 2022 2023 2024 2025 Conventional /Co-op(56) Seniors Housing(56) Student Housing(56) Manufactured Housing(56) Affordable(57) Total UPB (Dollars in billions) $504.5 $48.2 $207.0 $64.7 $65.4 $52.3 $55.1 $11.8 $455.2 $14.5 $12.8 $22.1 $61.5 % of Multifamily Guaranty Book 100% 10% 41% 13% 13% 10% 11% 2% 90% 3% 3% 4% 12% Loan Count 29,817 4,627 11,844 3,892 3,422 2,777 2,601 654 26,869 493 480 1,975 4,110 Average UPB (Dollars in millions) $16.9 $10.4 $17.5 $16.6 $19.1 $18.9 $21.2 $18.0 $16.9 $29.4 $26.6 $11.2 $15.0 Weighted-Average OLTV Ratio 63% 66% 65% 64% 59% 59% 62% 61% 63% 64% 65% 61% 67% Weighted-Average DSCR(52) 2.0 2.0 2.2 2.3 1.6 1.6 1.6 1.6 2.0 1.6 1.8 2.2 1.8 % with DSCR Below 1.0(52) 5% 6% 5% 4% 14% 4% * * 5% 21% 7% 2% 7% % Fixed Rate 93% 88% 95% 93% 81% 99% 100% 100% 94% 77% 84% 94% 89% % Full Interest-Only 45% 30% 38% 41% 54% 63% 62% 55% 46% 21% 34% 41% 29% % Partial Interest-Only(51) 44% 46% 51% 50% 39% 32% 31% 39% 43% 61% 60% 47% 46% % Small Balance Loans(53) 46% 67% 45% 44% 38% 40% 34% 37% 45% 19% 37% 66% 51% Serious Delinquency Rate(54) 0.63% 1.08% 0.46% 0.43% 1.53% 0.76% 0.02% —% 0.54% 4.09% 0.66% 0.13% 0.37% % Criticized(55) 6% 7% 6% 5% 15% 6% 1% —% 6% 25% 7% 2% 9% * represents less than 0.5% Credit Characteristics of Multifamily Guaranty Book of Business $40.6B $29.2B $21.6B $20.3B $14.6B $13.3B $13.2B $12.7B $12.4B $12.4B Share of Book of Business: 37.7% Total Top 10 UPB: $190.3B Total UPB: $504.5B UPB by Maturity Year As of March 31, 2025(10) Top 10 MSAs by UPB As of March 31, 2025(10) Certain Credit Characteristics of Guaranty Book(10) New York Dallas Chicago Denver Los Angeles Atlanta Phoenix Washington D.C. Seattle San Francisco 2025 2027 2029 - 2031 2026 2028 2032 - 2034 Other 2.1 2.2 2.0 2.0 2.0 65% 64% 63% 63% 63% 2021 2022 2023 2024 Q1 2025 Weighted-Average DSCR(52) Weighted-Average OLTV Ratio

Q1 2025 Financial Supplement | Multifamily 22© 2025 Fannie Mae DRAFT 0.71% 0.59% 0.24% 0.10% 0.05% 0.07% 0.05% 0.11% 0.06% 0.04% 0.98% 0.42% 0.24% 0.46% 0.57% 0.63% 27% 23% 12% 5% 4% 3% 2% 2% 3% 2% 3% 5% 6% 7% 7% 6% 2010 2011 2012 2013 2014 2015 2016 2017 2018 2019 2020 2021 2022 2023 2024 Q1 2025 Multifamily Problem Loan Statistics —%* —%* —%* 0.2% 1.2% 0.3% 0.1% 0.2% 0.1% 0.1% 0.1% —%* 0.2% 0.1% —%* —%* 2010 2011 2012 2013 2014 2015 2016 2017 2018 2019 2020 2021 2022 2023 2024 2025 Serious Delinquency Rate(54) and Percent Criticized(55) as of Period End Cumulative Total Credit Loss Rate, Net by Acquisition Year Through Q1 2025(58) * Represents less than 0.05% of cumulative total credit loss rate, net by acquisition year 222 260 128 118 62 12 13 11 16 12 14 31 28 61 139 148 2010 2011 2012 2013 2014 2015 2016 2017 2018 2019 2020 2021 2022 2023 2024 Q1 2025 REO Ending Inventory Serious Delinquency Rate Percent Criticized

Q1 2025 Financial Supplement | Definitions 23© 2025 Fannie Mae DRAFT CAS: Connecticut Avenue Securities® CIRT™: Credit Insurance Risk Transfer™ CRT: Credit risk transfer DSCR: Weighted-average debt service coverage ratio DTI ratio: Debt-to-income ("DTI") ratio refers to the ratio of a borrower's outstanding debt obligations (including both mortgage debt and certain other long-term and significant short-term debts) to that borrower's reported or calculated monthly income, to the extent the income is used to qualify for the mortgage DUS®: Fannie Mae's Delegated Underwriting and Servicing program LTV ratio: Loan-to-value ratio MSA: Metropolitan Statistical Area MTMLTV ratio: Mark-to-market loan-to-value ratio, which refers to the current unpaid principal balance of a loan at period end, divided by the estimated current home price at period end NCO: Net charge-offs, which refers to write-offs, net of recoveries. NPL: Nonperforming loan, which refers to loans that are 60 days or more delinquent. PD: Past due, which refers to loans that are delinquent. OLTV ratio: Original loan-to-value ratio, which refers to the unpaid principal balance of a loan at the time of origination of the loan, divided by the home price or property value at origination of the loan REO: Real estate owned by Fannie Mae because it has foreclosed on the property or obtained the property through a deed-in-lieu of foreclosure TCCA fees: Refers to revenues generated by the 10 basis point guaranty fee increase the company implemented on single-family residential mortgages pursuant to the Temporary Payroll Tax Cut Continuation Act of 2011 ("TCCA") and as extended by the Infrastructure Investment and Jobs Act, the incremental revenue from which is paid to Treasury and not retained by the company UPB: Unpaid principal balance Definitions

Q1 2025 Financial Supplement | Endnotes 24© 2025 Fannie Mae DRAFT Endnotes (1) Consists of salaries and employee benefits and professional services, technology and occupancy expenses. (2) Single-family credit enhancement expense consists of costs associated with the company's freestanding credit enhancements, which primarily include the company's Connecticut Avenue Securities® and Credit Insurance Risk TransferTM programs, enterprise-paid mortgage insurance and certain lender risk-sharing programs. Multifamily credit enhancement expense primarily consists of costs associated with the company's Multifamily CIRTTM and Multifamily CAS programs as well as amortization expense for certain lender risk-sharing programs. Excludes CAS transactions accounted for as debt instruments and credit risk transfer programs accounted for as derivative instruments. (3) Other income (expense), net primarily consists of foreclosed property income (expense), change in the expected benefits from the company's freestanding credit enhancements, and gains and losses from partnership investments. (4) Calculated based upon net worth divided by total assets outstanding at the end of the period. (5) Calculated based on annualized net income for the reporting period divided by average total assets during the period, expressed as a percentage. Average balances for purposes of ratio calculations are based on quarter-end balances. (6) Efficiency ratio is calculated as non-interest expense divided by the sum of net interest income and non-interest income. As presented in the Corporate Highlights slide of this Financial Supplement, non-interest income consists of the sum of “Fee and other income,” “Investment gains (losses), net” and “Fair value gains (losses), net.” (7) Consists of the company's allowance for loan losses, allowance for accrued interest receivable and reserve for guaranty losses. (8) Home price estimates are based on purchase transactions in Fannie-Freddie acquisition and public deed data available through the end of March 2025. Including subsequent data may lead to materially different results. Home price growth rate is not seasonally adjusted. UPB estimates are based on data available through the end of March 2025, and the top 10 states are reported by UPB in descending order. One-year home price growth rate is for the 12-month period ending March 31, 2025. (9) Single-family conventional loan population consists of: (a) single-family conventional mortgage loans of Fannie Mae and (b) single-family conventional mortgage loans underlying Fannie Mae MBS other than loans underlying Freddie Mac securities that Fannie Mae has resecuritized. It excludes non-Fannie Mae single-family mortgage-related securities held in the retained mortgage portfolio for which Fannie Mae does not provide a guaranty. Conventional refers to mortgage loans and mortgage-related securities that are not guaranteed or insured, in whole or in part, by the U.S. government or one of its agencies. (10) The multifamily guaranty book of business consists of: (a) multifamily mortgage loans of Fannie Mae; (b) multifamily mortgage loans underlying Fannie Mae MBS; and (c) other credit enhancements that the company provided on multifamily mortgage assets. It excludes non-Fannie Mae multifamily mortgage-related securities held in the retained mortgage portfolio for which Fannie Mae does not provide a guaranty. (11) Net interest margin is calculated based on net interest income for the reporting period as a percentage of average total interest-earning assets during the period. For additional information, refer to "MD&A—Consolidated Results of Operations—Net Interest Income—Analysis of Net Interest Income” in the company's applicable Form 10-Q and Form 10-K filings. (12) Represents, on an annualized basis, the average of the base guaranty fees charged during the period for the company's single-family conventional guaranty arrangements plus the recognition of any upfront cash payments relating to these guaranty arrangements based on an estimated average life at the time of acquisition (in basis points). Excludes the impact of a 10 basis point guaranty fee increase implemented pursuant to the TCCA, the incremental revenue from which is paid to Treasury and not retained by the company. (13) Average charged guaranty fee rate on multifamily guaranty book of business (in basis points), at end of period. (14) To derive the average total book guaranty fee, the average single-family and multifamily guaranty fees are weighted based on the size of the segment’s guaranty book of business. (15) Base guaranty fee income, net of TCCA, is interest income from the guaranty book of business excluding the impact of a 10 basis point guaranty fee increase implemented in 2012 pursuant to the Temporary Payroll Tax Cut Continuation Act of 2011 and as extended by the Infrastructure Investment and Jobs Act, the incremental revenue from which is paid to Treasury and not retained by the company. (16) "Deferred guaranty fee income" refers to income primarily from the upfront fees that the company receives at the time of loan acquisition related to single-family loan-level price adjustments or other fees the company receives from lenders, which are amortized over the contractual life of the loan. Deferred guaranty fee income also includes the amortization of cost basis adjustments on mortgage loans and debt of consolidated trusts that are not associated with upfront fees.

Q1 2025 Financial Supplement | Endnotes 25© 2025 Fannie Mae DRAFT Endnotes (17) Net interest income from portfolios consists of: interest income from assets held in the company's retained mortgage portfolio and corporate liquidity portfolio; interest income from other assets used to support lender liquidity; and interest expense on the company's outstanding corporate debt and Connecticut Avenue Securities® debt. For purposes of this Financial Supplement chart, income (expense) from hedge accounting is included in the "net interest income from portfolios & hedge impact" category; however, the company does not consider income (expense) from hedge accounting to be a component of net interest income from portfolios. The company had $178 million in hedge accounting expense for the three months ended March 31, 2025. (18) Cash equivalents are composed of overnight reverse repurchase agreements and U.S. Treasuries that have a maturity at the date of acquisition of three months or less. (19) Consists of mortgage loans and mortgage-related securities that the company owns, including Fannie Mae MBS and non-Fannie Mae mortgage-related securities. Assets held by consolidated MBS trusts that back mortgage-related securities owned by third parties are not included in the retained mortgage portfolio. The company classifies its retained mortgage portfolio into three categories: lender liquidity, loss mitigation and other, which categories are described in the company's Q1 2025 Form 10-Q and 2024 Form 10-K. (20) Outstanding debt balance consists of the unpaid principal balance, premiums and discounts, fair value adjustments, hedge-related basis adjustments and other cost basis adjustments. (21) Percentages are weighted averages and are based on the aggregate unpaid principal balance of the single-family conventional, multifamily, or total guaranty books of business as of period end. Single-family SDQ rate refers to the aggregate unpaid principal balance of single-family loans that are 90 days or more past due or in the foreclosure process. This presentation of single-family SDQ rate differs from presentation based on loan count elsewhere in this Financial Supplement. Multifamily SDQ rate refers to the aggregate unpaid principal balance of multifamily loans that are 60 days or more past due. (22) The nonperforming loan ("NPL") rate is based on the aggregate unpaid principal balance of single-family, multifamily, or total loans delinquent 60 days or more as a percentage of the company's single-family conventional, multifamily or total guaranty books of business. (23) The company's single-family, multifamily or total allowance for credit losses as a percentage of the company's single-family conventional, multifamily or total guaranty books of business. Multifamily allowance for credit losses excludes the expected benefit of freestanding credit enhancements on multifamily loans, which are recorded in "Other assets" in the company's consolidated balance sheets. For additional information, refer to “MD&A—Consolidated Credit Ratios and Select Credit Information” in the company’s applicable Form 10- Q and Form 10-K filings. (24) The net charge-off ("NCO") rate is based on annualized write-offs, net of recoveries, for single-family, multifamily, or total, where write-offs are when a loan is determined to be uncollectible or upon the redesignation of single-family mortgage loans from held for investment to held for sale, as a percentage of the average aggregate unpaid principal balance of the single-family conventional, multifamily, or total guaranty books of business during the period. For additional information, refer to “MD&A—Consolidated Credit Ratios and Select Credit Information” in the company's applicable Form 10-Q and Form 10-K filings. (25) Fannie Mae information is as of 3/31/2025. U.S. G-SIB Banks represent the applicable capital requirements that are effective October 2024. Ratios are calculated as a percentage of risk-weighted assets for risk-based capital metrics and as a percentage of adjusted total assets for leverage capital metrics. Fannie Mae's risk-based capital ratio requirement includes capital buffers. The U.S. G-SIB Banks' leverage ratio requirement represents the minimum regulatory tier 1 leverage ratio requirement. Fannie Mae's tier 1 leverage ratio requirement includes capital buffers. Tier 1 leverage ratio under the enterprise regulatory capital framework is calculated as required tier 1 capital divided by adjusted total assets. (26) The enterprise regulatory capital framework became effective on January 1, 2022, and has a transition period for compliance, as described in the company's 2024 Form 10-K. While the company is in conservatorship, the company is not required to comply with the minimum capital or buffer requirements. (27) U.S. G-SIB Banks refers to United States global systemically important banks, as defined by the Financial Stability Board, which as of November 2024 consisted of Bank of America Corp., Bank of New York Mellon Corp., Citigroup Inc., Goldman Sachs Group Inc., JPMorgan Chase & Co., Morgan Stanley, State Street Corp., and Wells Fargo & Co. U.S. G-SIB Bank capital metrics represent the average of those banks' capital requirements post-2024 stress test as outlined by the Federal Reserve. See https://www.federalreserve.gov/ publications/files/large-bank-capital-requirements-20240828.pdf (28) CET1 requirement as presented represents the company's average CET1 capital requirement under the enterprise regulatory capital framework for the applicable periods (which is not currently in effect while the company is in conservatorship) and not the amount of the company's actual average CET1 capital for the reported periods. The return on average required CET1 ratio for the first quarter of 2025 is calculated based on annualized net income for the reporting period.

Q1 2025 Financial Supplement | Endnotes 26© 2025 Fannie Mae DRAFT Endnotes (29) Net worth is also reported as stockholders' equity on the company's GAAP financial statements. (30) Stated value of the senior preferred stock was $120.8 billion as of March 31, 2025. (31) The $41 billion of available regulatory capital the company built since January 2023 consists of the sum of: net income we earned and the amount by which the company's deferred tax assets changed. This amount is calculated using total risk-based adjusted capital. (32) Minimum capital requirement does not include buffers. (33) FICO credit score is as of loan origination, as reported by the seller of the mortgage loan. (34) Excludes loans for which this information is not readily available. From time to time, the company revises its guidelines for determining a borrower's DTI ratio. The amount of income reported by a borrower and used to qualify for a mortgage may not represent the borrower's total income; therefore, the DTI ratios reported may be higher than borrowers' actual DTI ratios. (35) Refers to HomeReady® mortgage loans, a low down payment mortgage product offered by the company that is designed for creditworthy low-income borrowers. HomeReady allows up to 97% loan-to-value ratio financing for home purchases. The company offers additional low down payment mortgage products that are not HomeReady loans; therefore, this category is not representative of all high LTV ratio single-family loans acquired or in the single-family conventional guaranty book of business for the periods shown. See the "OLTV Ratio > 95%" category for information on the single-family loans acquired or in the single-family conventional guaranty book of business with original LTV ratios greater than 95%. (36) Calculated based on the aggregate unpaid principal balance of single-family loans for each category divided by the aggregate unpaid principal balance of loans in the single-family conventional guaranty book of business. Loans with multiple product features are included in all applicable categories. (37) Percentage of loans in the single-family conventional guaranty book of business, measured by unpaid principal balance, included in an agreement used to reduce credit risk by requiring collateral, letters of credit, mortgage insurance, corporate guarantees, inclusion in a credit risk transfer transaction reference pool, or other agreement that provides for Fannie Mae's compensation to some degree in the event of a financial loss relating to the loan. (38) Single-family serious delinquency ("SDQ") rate refers to single-family loans that are 90 days or more past due or in the foreclosure process, expressed as a percentage of the company’s single-family conventional guaranty book of business, based on loan count. Single-family SDQ rate for loans in a particular category refers to SDQ loans in the applicable category, divided by the number of loans in the single-family conventional guaranty book of business in that category. (39) Calculated based on the number of single-family loans that were seriously delinquent for each category divided by the total number of single-family conventional loans that were seriously delinquent. (40) The average estimated mark-to-market LTV ratio is based on the unpaid principal balance of the loan divided by the estimated current value of the property at period end, which the company calculates using an internal valuation model that estimates periodic changes in home value. Excludes loans for which this information is not readily available. (41) Refers to loans included in an agreement used to reduce credit risk by requiring primary mortgage insurance, collateral, letters of credit, corporate guarantees, or other agreements to provide an entity with some assurance that it will be compensated to some degree in the event of a financial loss. Excludes loans covered by credit risk transfer transactions unless such loans are also covered by primary mortgage insurance. (42) Outstanding unpaid principal balance represents the underlying loan balance, which is different from the reference pool balance for CAS and some lender risk-sharing transactions. (43) Includes mortgage pool insurance transactions. (44) Based on the unpaid principal balance of the single-family conventional guaranty book of business as of period end. (45) Measured from the borrowers' last paid installment on their mortgages to when the related properties were added to the company's REO inventory for foreclosures completed during the three months ended March 31, 2025. Home Equity Conversion Mortgages insured by the Department of Housing and Urban Development are excluded from this calculation. For New Jersey, there were no single-family conventional loan foreclosures during the three months ended March 31, 2025. (46) This chart does not include loans in an active forbearance arrangement, trial modifications, and repayment plans that have been initiated but not completed. There were approximately 24,000 loans in a trial modification period that was not complete as of March 31, 2025. (47) Includes repayment plans and foreclosure alternatives. Repayment plans reflect only those plans associated with loans that were 60 days or more delinquent.

Q1 2025 Financial Supplement | Endnotes 27© 2025 Fannie Mae DRAFT Endnotes (48) Defaults include loan foreclosures, short sales, sales to third parties at the time of foreclosure and deeds-in-lieu of foreclosure. Cumulative Default Rate is the total number of single- family conventional loans in the guaranty book of business originated in the identified year that have defaulted, divided by the total number of single-family conventional loans in the guaranty book of business originated in the identified year. Data as of March 31, 2025 is not necessarily indicative of the ultimate performance of the loans and performance may change, perhaps materially, in future periods. (49) Represents the percentage of loans with lender risk-sharing agreements in place, measured by unpaid principal balance. (50) Under the Delegated Underwriting and Servicing ("DUS") program, Fannie Mae acquires individual, newly originated mortgages from specially approved DUS lenders using DUS underwriting standards and/or DUS loan documents. Because DUS lenders generally share the risk of loss with Fannie Mae, they are able to originate, underwrite, close and service most loans without a pre-review by the company. (51) Includes any loan that was underwritten with an interest-only term less than the term of the loan, regardless of whether it is currently in its interest-only period. (52) Estimates of current DSCRs are based on the latest available income information covering a 12 month period, from quarterly and annual statements for these properties including the related debt service. When an annual statement is the latest statement available, it is used. When operating statement information is not available, the underwritten DSCR is used. Co-op loans are excluded from this metric. (53) Small balance loans refer to multifamily loans with an original unpaid principal balance of up to $9 million. Small balance loans are included within the asset class categories referenced above. The company presents this metric in the table based on loan count rather than unpaid principal balance. Small balance loans comprised 10% of the company's multifamily guaranty book of business as of both March 31, 2025 and December 31, 2024. (54) Multifamily serious delinquency rate refers to multifamily loans that are 60 days or more past due, expressed as a percentage of the company’s multifamily guaranty book of business, based on unpaid principal balance. Multifamily serious delinquency rate for loans in a particular category (such as acquisition year, asset class or targeted affordable segment), refers to seriously delinquent loans in the applicable category, divided by the unpaid principal balance of the loans in the multifamily guaranty book of business in that category. (55) Criticized loans represent loans classified as "Special Mention," "Substandard" or "Doubtful." Loans classified as "Special Mention" refers to loans that are otherwise performing but have potential weaknesses that, if left uncorrected, may result in deterioration in the borrower’s ability to repay in full. Loans classified as "Substandard" have a well-defined weakness that jeopardizes the timely full repayment. "Doubtful" refers to a loan with a weakness that makes collection or liquidation in full highly questionable and improbable based on existing conditions and values. (56) See https://multifamily.fanniemae.com/financing-options for definitions. Loans with multiple product features are included in all applicable categories. (57) Represents Multifamily Affordable Housing loans, which are defined as financing for properties that are under an agreement that provides long-term affordability, such as properties with rent subsidies or income restrictions. (58) Cumulative net credit loss rate is the cumulative net credit losses through March 31, 2025 on the multifamily loans that were acquired in the applicable period, as a percentage of the total acquired unpaid principal balance of multifamily loans that were acquired in the applicable period. Net credit losses include expected benefit of freestanding loss-sharing arrangements, primarily multifamily DUS lender risk-sharing transactions. Credit loss rate for 2014 acquisitions was primarily driven by the write-off of a seniors housing portfolio in Q1 2023.