UNITED STATES
SECURITIES AND EXCHANGE COMMISSION
Washington, DC 20549
FORM 8-K
CURRENT REPORT
Pursuant to Section 13 or 15(d) of The Securities Exchange Act of 1934
Date of Report (Date of earliest event reported): April 29, 2026
Federal National Mortgage Association
(Exact name of registrant as specified in its charter)
Fannie Mae
| Federally chartered corporation | ||||||||||||||||||||||||||||||||
| (State or other jurisdiction of incorporation) | (Commission File Number) | (IRS Employer Identification No.) | (Address of principal executive offices, including zip code) | (Registrant’s telephone number, including area code) | ||||||||||||||||||||||||||||
Check the appropriate box below if the Form 8-K filing is intended to simultaneously satisfy the filing obligation of the registrant under any of the following provisions (see General Instruction A.2. below):
| Written communications pursuant to Rule 425 under the Securities Act (17 CFR 230.425) | |||||
| Soliciting material pursuant to Rule 14a-12 under the Exchange Act (17 CFR 240.14a-12) | |||||
| Pre-commencement communications pursuant to Rule 14d-2(b) under the Exchange Act (17 CFR 240.14d-2(b)) | |||||
| Pre-commencement communications pursuant to Rule 13e-4(c) under the Exchange Act (17 CFR 240.13e-4(c)) | |||||
Securities registered pursuant to Section 12(b) of the Act:
| Title of each class | Trading Symbol(s) | Name of each exchange on which registered | ||||||
| None | N/A | N/A | ||||||
Indicate by check mark whether the registrant is an emerging growth company as defined in Rule 405 of the Securities Act of 1933 (§230.405 of this chapter) or Rule 12b-2 of the Securities Exchange Act of 1934 (§240.12b-2 of this chapter).
| Emerging growth company | ||||||||
If an emerging growth company, indicate by check mark if the registrant has elected not to use the extended transition period for complying with any new or revised financial accounting standards provided pursuant to Section 13(a) of the Exchange Act. ☐
The information in this report, including information contained in the exhibits submitted with this report, shall not be deemed “filed” for purposes of Section 18 of the Securities Exchange Act of 1934, or otherwise subject to the liabilities of Section 18, nor shall it be deemed incorporated by reference into any disclosure document relating to Fannie Mae (formally known as the Federal National Mortgage Association), except to the extent, if any, expressly incorporated by specific reference in that document.
Item 2.02 Results of Operations and Financial Condition.
On April 29, 2026, Fannie Mae filed its quarterly report on Form 10-Q for the quarter ended March 31, 2026, and is issuing a press release reporting its financial results for the periods covered by the Form 10-Q, as well as an earnings presentation and a financial supplement. Copies of the press release, earnings presentation, and financial supplement are furnished as Exhibits 99.1, 99.2, and 99.3, respectively, to this report and are incorporated herein by reference. Copies may also be found on Fannie Mae’s website, www.fanniemae.com, in the “About Us” section under “Investor Relations/Quarterly and Annual Results.” Information appearing on the company’s website is not incorporated into this report.
Item 9.01 Financial Statements and Exhibits.
(d) Exhibits. The following exhibits are being submitted with this report:
| Exhibit Number | Description of Exhibit | |||||||
| 99.1 | ||||||||
| 99.2 | ||||||||
| 99.3 | ||||||||
| 104 | Cover Page Interactive Data File (embedded within the Inline XBRL document) | |||||||
SIGNATURES
Pursuant to the requirements of the Securities Exchange Act of 1934, the registrant has duly caused this report to be signed on its behalf by the undersigned hereunto duly authorized.
| FEDERAL NATIONAL MORTGAGE ASSOCIATION | ||||||||
| By: | /s/ Chryssa C. Halley | |||||||
| Chryssa C. Halley | ||||||||
| Executive Vice President and Chief Financial Officer | ||||||||
Date: April 29, 2026

Exhibit 99.1
Fannie Mae Earns $3.7 Billion in First Quarter 2026
•33rd straight quarterly profit driven by steady net revenues(1) and stable guaranty book
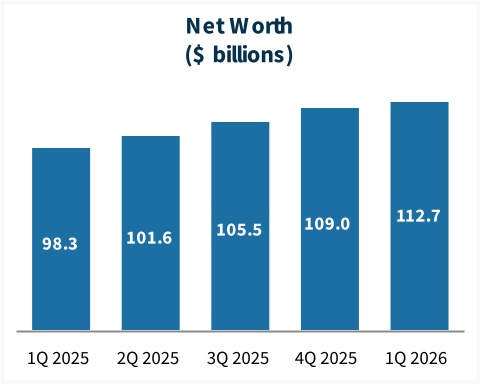
•Net worth reached $112.7 billion; a $99.2 billion increase since the start of 2020
•Administrative expenses fell 19% from prior quarter, reflecting cost-cutting actions and enhanced operational efficiency
•Illustrative return on average required CET1(2) capital of 10.4%, up from 10.2% in the fourth quarter of 2025
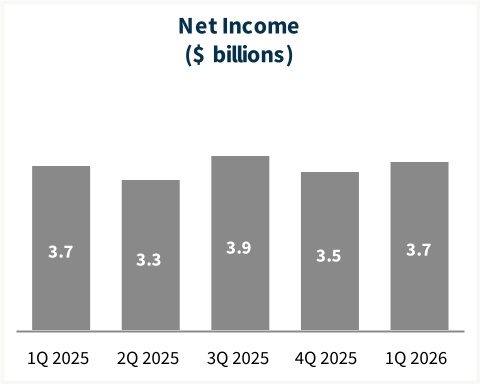
WASHINGTON, DC – April 29, 2026 – Fannie Mae (FNMA/OTCQB) earned $3.7 billion in net income for the first quarter of 2026, compared with $3.5 billion for the fourth quarter of 2025, and increased its net worth to $112.7 billion as of March 31, 2026. Net revenues were steady compared with the fourth quarter of 2025; the increase in net income was primarily driven by a shift from fair value losses to gains and lower administrative expenses, partially offset by a shift from investment gains to losses.
William J. Pulte, Director, U.S. Federal Housing, and Chairman, Fannie Mae Board of Directors:
“Fannie Mae is a far more effective and leaner company than it was a year ago, with solid earnings, lower expenses, and $112.7 billion in net worth. A financially sound and dependable Fannie Mae is essential to the long-term health of the housing and mortgage markets.”
“Fannie Mae is a far more effective and leaner company than it was a year ago, with solid earnings, lower expenses, and $112.7 billion in net worth. A financially sound and dependable Fannie Mae is essential to the long-term health of the housing and mortgage markets.”
Peter Akwaboah, Acting Chief Executive Officer and Chief Operating Officer, Fannie Mae:
“Fannie Mae’s first quarter net income of $3.7 billion reflects the health of our guaranty business, the discipline of our execution, and the strength of our balance sheet. We remain focused on our mission — to provide uninterrupted liquidity in all economic cycles to support stability and affordability to the U.S. housing market.”
“Fannie Mae’s first quarter net income of $3.7 billion reflects the health of our guaranty business, the discipline of our execution, and the strength of our balance sheet. We remain focused on our mission — to provide uninterrupted liquidity in all economic cycles to support stability and affordability to the U.S. housing market.”
More information, including access to the webcast featuring our earnings presentation, our First Quarter 2026 Form 10-Q, and other disclosures, can be found on our Quarterly and Annual Results webpage at fanniemae.com/financialresults.
First Quarter 2026 Key Metrics | ||||||||||||||||||||||||||||||||||||||
$3.7 billion | $112.7 billion | $7.3 billion | ||||||||||||||||||||||||||||||||||||
| Net Income | Net Worth | Net Revenues(1) | ||||||||||||||||||||||||||||||||||||
($3.5 billion in 4Q 2025) | ($109.0 billion in 4Q 2025) | ($7.3 billion in 4Q 2025) | ||||||||||||||||||||||||||||||||||||
$4.1 trillion | 10.2% | 10.4% | ||||||||||||||||||||||||||||||||||||
| Guaranty Book of Business | Administrative Expense Ratio(3) | Illust. Return on Avg. Req. CET1(2) | ||||||||||||||||||||||||||||||||||||
($4.1 trillion in 4Q 2025) | (12.6% in 4Q 2025) | (10.2% in 4Q 2025) | ||||||||||||||||||||||||||||||||||||
Business Impact and Quarterly Highlights | ||||||||||||||||||||||||||||||||||||||
Mortgage Acquisitions
Enabled the financing of ~385,000 home purchases,
refinances, and rental units in the first quarter of 2026
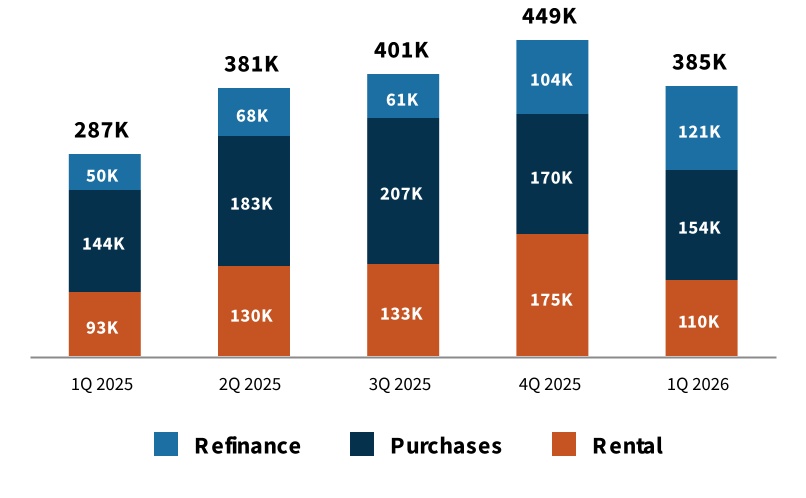
$116 billion in liquidity provided to mortgage market, supporting approximately 154,000 home purchases, 121,000 refinancings, and 110,000 rental units. | |||||||||||||||||
More than 80% of multifamily units financed were affordable to renters earning less than 100% of area median income. | |||||||||||||||||
First-time homebuyers accounted for more than half of our single-family purchase mortgages. | |||||||||||||||||
Our foreclosure prevention solutions allowed more than 24,000 homeowners to remain in their homes. | |||||||||||||||||
Enhanced support of the secondary mortgage market through MBS purchases. | |||||||||||||||||
Endnotes are presented on page 5
First Quarter 2026 | 1 | |||||||
Summary of Financial Results
Chryssa C. Halley, Chief Financial Officer, Fannie Mae:
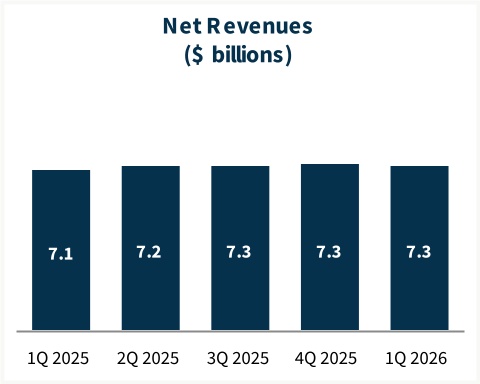
“Our first quarter results underscore the durability of our business model and the strong credit profile of our guaranty book. Net revenues in the quarter were stable at $7.3 billion, administrative expenses were lower, and our growing net worth put Fannie Mae in a solid position to serve the housing market and fulfill our mission.”
“Our first quarter results underscore the durability of our business model and the strong credit profile of our guaranty book. Net revenues in the quarter were stable at $7.3 billion, administrative expenses were lower, and our growing net worth put Fannie Mae in a solid position to serve the housing market and fulfill our mission.”
Key Highlights — First Quarter 2026 | |||||
| • | Net revenues of $7.3 billion, primarily driven by guaranty fees on the company’s $4.1 trillion guaranty book of business. | ||||
◦Single-family net revenues of $6.0 billion from a $3.6 trillion conventional guaranty book with an average charged guaranty fee of 48.8 basis points. | |||||
◦Multifamily net revenues of $1.2 billion from a $542.5 billion guaranty book with an average charged guaranty fee of 71.1 basis points. | |||||
| • | Provision for credit losses of $277 million, compared with $298 million in 4Q 2025. | ||||
| • | Non-interest expense of $2.2 billion, compared with $2.4 billion in 4Q 2025; decrease driven primarily by lower administrative expenses. | ||||
| • | Other losses decreased by $96 million compared with 4Q 2025, driven by a shift from fair value losses to fair value gains, which was partially offset by a shift from investment gains to investment losses. | ||||
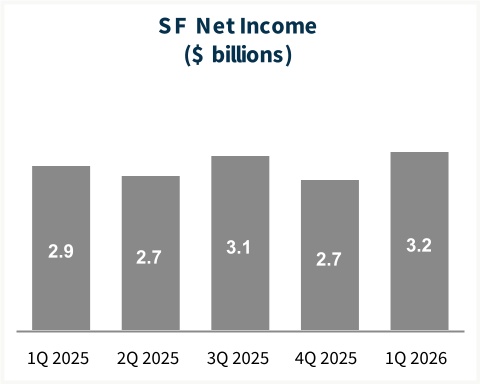
| • | Net income of $3.7 billion, compared with $3.5 billion in 4Q 2025; net worth increased to $112.7 billion. | ||||
| Summary of Consolidated Financial Results | ||||||||||||||||||||||||||||||||||||||||||||
| (Dollars in millions) | 1Q26 | 4Q25 | Variance | % Change | 1Q25 | Variance | % Change | |||||||||||||||||||||||||||||||||||||
| Net interest income | $ | 7,198 | $ | 7,268 | $ | (70) | (1) | % | $ | 7,001 | $ | 197 | 3 | % | ||||||||||||||||||||||||||||||
| Fee and other income | 82 | 63 | 19 | 30 | % | 84 | (2) | (2) | % | |||||||||||||||||||||||||||||||||||
| Net revenues | 7,280 | 7,331 | (51) | (1) | % | 7,085 | 195 | 3 | % | |||||||||||||||||||||||||||||||||||
| Fair value gains (losses), net | 121 | (257) | 378 | NM | 123 | $ | (2) | (2) | % | |||||||||||||||||||||||||||||||||||
| Investment gains (losses), net | (277) | 5 | (282) | NM | (1) | (276) | NM | |||||||||||||||||||||||||||||||||||||
| Other gains (losses), net | (156) | (252) | 96 | 38 | % | 122 | (278) | NM | ||||||||||||||||||||||||||||||||||||
| (Provision) benefit for credit losses | (277) | (298) | 21 | 7 | % | (24) | (253) | NM | ||||||||||||||||||||||||||||||||||||
| Non-interest expense: | ||||||||||||||||||||||||||||||||||||||||||||
Administrative expenses(4) | (745) | (921) | 176 | 19 | % | (992) | 247 | 25 | % | |||||||||||||||||||||||||||||||||||
Legislative assessments(5) | (931) | (936) | 5 | 1 | % | (931) | — | — | %* | |||||||||||||||||||||||||||||||||||
Credit enhancement expense(6) | (358) | (368) | 10 | 3 | % | (479) | 121 | 25 | % | |||||||||||||||||||||||||||||||||||
Other income (expense), net(7) | (149) | (146) | (3) | (2) | % | (197) | 48 | 24 | % | |||||||||||||||||||||||||||||||||||
| Total non-interest expense | (2,183) | (2,371) | 188 | 8 | % | (2,599) | 416 | 16 | % | |||||||||||||||||||||||||||||||||||
| Income before federal income taxes | 4,664 | 4,410 | 254 | 6 | % | 4,584 | 80 | 2 | % | |||||||||||||||||||||||||||||||||||
| Provision for federal income taxes | (944) | (883) | (61) | (7) | % | (923) | (21) | (2) | % | |||||||||||||||||||||||||||||||||||
| Net income | $ | 3,720 | $ | 3,527 | $ | 193 | 5 | % | $ | 3,661 | $ | 59 | 2 | % | ||||||||||||||||||||||||||||||
| — | — | |||||||||||||||||||||||||||||||||||||||||||
| Total comprehensive income | $ | 3,655 | $ | 3,527 | $ | 128 | 4 | % | $ | 3,655 | $ | — | — | %* | ||||||||||||||||||||||||||||||
| Net worth | $ | 112,667 | $ | 109,012 | $ | 3,655 | 3 | % | $ | 98,312 | $ | 14,355 | 15 | % | ||||||||||||||||||||||||||||||
| NM - Not meaningful | ||||||||||||||||||||||||||||||||||||||||||||
| * Represents less than 0.5% | ||||||||||||||||||||||||||||||||||||||||||||
First Quarter 2026 | 2 | |||||||
Single-Family Business
Jake Williamson, EVP, Head of Single-Family, Fannie Mae:
“We are making it easier for lenders to do business with Fannie Mae by delivering technology-enabled solutions that reduce friction and streamline the mortgage process. That focus will help make Fannie Mae the go-to partner for lenders as they meet the evolving needs of homebuyers and homeowners.”
“We are making it easier for lenders to do business with Fannie Mae by delivering technology-enabled solutions that reduce friction and streamline the mortgage process. That focus will help make Fannie Mae the go-to partner for lenders as they meet the evolving needs of homebuyers and homeowners.”
Single-Family Highlights — First Quarter 2026 | |||||
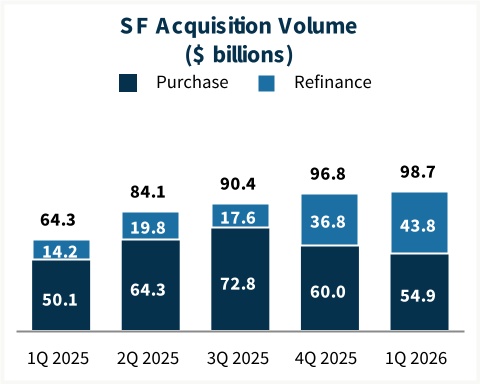
| • | Single-family conventional acquisition volume increased to $98.7 billion, compared with $96.8 billion in 4Q 2025, driven by a $7.0 billion increase in refinance acquisition volume, partially offset by a $5.1 billion decrease in purchase acquisition volume. | ||||
| • | Average single-family conventional guaranty book decreased to $3.56 trillion, from $3.58 trillion for 4Q 2025. | ||||
| • | The average charged guaranty fee, net of TCCA fees, on the single-family conventional guaranty book increased to 48.8 basis points, compared with 48.7 basis points in 4Q 2025. The average charged guaranty fee on newly acquired conventional loans, net of TCCA fees, decreased to 55.1 basis points, compared with 55.4 basis points in 4Q 2025. | ||||
| • | Overall credit characteristics of the single-family conventional guaranty book were largely unchanged compared with the prior quarter, with a weighted-average mark-to-market loan-to-value ratio of 51% and a weighted-average FICO credit score at origination of 753 as of Mar. 31, 2026. | ||||
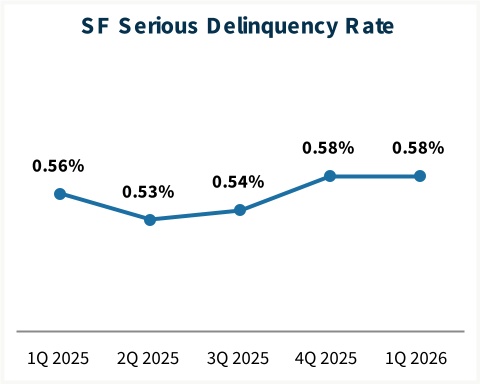
| • | Single-family serious delinquency rate remained unchanged at 0.58% as of Mar. 31, 2026, compared with prior quarter end.(8) | ||||
| • | Provision for single-family credit losses of $103 million, primarily associated with new acquisitions and newly delinquent loans, partially offset by a benefit from actual home price growth. This compares with a provision for single-family credit losses of $293 million for 4Q 2025. | ||||
| Single-Family Business Financial Results | ||||||||||||||||||||||||||||||||||||||||||||
| (Dollars in millions) | 1Q26 | 4Q25 | Variance | % Change | 1Q25 | Variance | % Change | |||||||||||||||||||||||||||||||||||||
| Net interest income | $ | 5,978 | $ | 6,043 | $ | (65) | (1) | % | $ | 5,866 | $ | 112 | 2 | % | ||||||||||||||||||||||||||||||
| Fee and other income | 61 | 43 | 18 | 42 | % | 65 | (4) | (6) | % | |||||||||||||||||||||||||||||||||||
| Net revenues | 6,039 | 6,086 | (47) | (1) | % | 5,931 | 108 | 2 | % | |||||||||||||||||||||||||||||||||||
| Fair value gains (losses), net | 204 | (273) | 477 | NM | 82 | 122 | 149 | % | ||||||||||||||||||||||||||||||||||||
| Investment gains (losses), net | (257) | (14) | (243) | NM | 1 | (258) | NM | |||||||||||||||||||||||||||||||||||||
| Other gains (losses), net | (53) | (287) | 234 | 82 | % | 83 | (136) | NM | ||||||||||||||||||||||||||||||||||||
| (Provision) benefit for credit losses | (103) | (293) | 190 | 65 | % | (24) | (79) | NM | ||||||||||||||||||||||||||||||||||||
| Non-interest expense: | ||||||||||||||||||||||||||||||||||||||||||||
Administrative expenses(4) | (601) | (750) | 149 | 20 | % | (812) | 211 | 26 | % | |||||||||||||||||||||||||||||||||||
Legislative assessments(5) | (918) | (921) | 3 | — | %* | (920) | 2 | — | %* | |||||||||||||||||||||||||||||||||||
Credit enhancement expense(6) | (280) | (288) | 8 | 3 | % | (407) | 127 | 31 | % | |||||||||||||||||||||||||||||||||||
Other income (expense), net(7) | (90) | (173) | 83 | 48 | % | (173) | 83 | 48 | % | |||||||||||||||||||||||||||||||||||
| Total non-interest expense | (1,889) | (2,132) | 243 | 11 | % | (2,312) | 423 | 18 | % | |||||||||||||||||||||||||||||||||||
| Income before federal income taxes | 3,994 | 3,374 | 620 | 18 | % | 3,678 | 316 | 9 | % | |||||||||||||||||||||||||||||||||||
| Provision for federal income taxes | (820) | (697) | (123) | (18) | % | (760) | (60) | (8) | % | |||||||||||||||||||||||||||||||||||
| Net income | $ | 3,174 | $ | 2,677 | $ | 497 | 19 | % | $ | 2,918 | $ | 256 | 9 | % | ||||||||||||||||||||||||||||||
| Average charged guaranty fee on new conventional acquisitions, net of TCCA fees | 55.1 bps | 55.4 bps | (0.3) bps | (1) | % | 56.5 bps | (1.4) bps | (2) | % | |||||||||||||||||||||||||||||||||||
| Average charged guaranty fee on conventional guaranty book of business, net of TCCA fees | 48.8 bps | 48.7 bps | 0.1 bps | — | %* | 48.1 bps | 0.7 bps | 1 | % | |||||||||||||||||||||||||||||||||||
First Quarter 2026 | 3 | |||||||
Multifamily Business
Kelly Follain, EVP, Head of Multifamily, Fannie Mae:
“The first quarter reinforced the strength of our DUS® model and lender partnerships, supporting liquidity for multifamily borrowers and advancing the financing of affordable rental housing. As our book of business grew to $542.5 billion, we remained focused on delivering disciplined and flexible support in a dynamic market.”
“The first quarter reinforced the strength of our DUS® model and lender partnerships, supporting liquidity for multifamily borrowers and advancing the financing of affordable rental housing. As our book of business grew to $542.5 billion, we remained focused on delivering disciplined and flexible support in a dynamic market.”
Multifamily Highlights — First Quarter 2026 | |||||
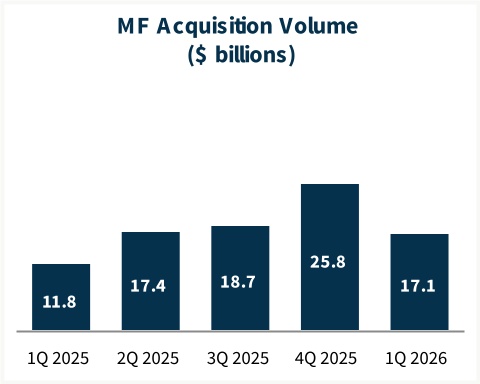
| • | Multifamily acquisition volume declined to $17.1 billion, compared with $25.8 billion in 4Q 2025. | ||||
| • | Multifamily book of business grew to $542.5 billion as of Mar. 31, 2026, a $7.8 billion increase from Dec. 31, 2025. | ||||
| • | Average charged guaranty fees on overall multifamily book decreased by 0.5 basis points to 71.1 basis points as of Mar. 31, 2026, compared with 71.6 basis points as of Dec. 31, 2025. | ||||
| • | Overall credit characteristics of the multifamily guaranty book were largely unchanged compared with the prior quarter, with weighted-average original loan-to-value ratio of 63% and a weighted-average debt service coverage ratio of 1.9 as of Mar. 31, 2026. | ||||
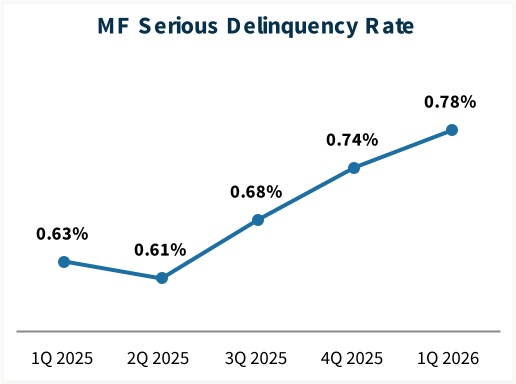
| • | Multifamily serious delinquency rate increased to 0.78% as of Mar. 31, 2026, compared with 0.74% as of Dec. 31, 2025.(9) | ||||
| • | Provision for multifamily credit losses of $174 million, primarily associated with an increase in loan delinquencies and by weakened property valuations on certain problem loans. This compares to a multifamily provision for credit losses of $5 million for 4Q 2025. | ||||
Multifamily Business Financial Results | ||||||||||||||||||||||||||||||||||||||||||||
| (Dollars in millions) | 1Q26 | 4Q25 | Variance | % Change | 1Q25 | Variance | % Change | |||||||||||||||||||||||||||||||||||||
| Net interest income | $ | 1,220 | $ | 1,225 | $ | (5) | — | %* | $ | 1,135 | $ | 85 | 7 | % | ||||||||||||||||||||||||||||||
| Fee and other income | 21 | 20 | 1 | 5 | % | 19 | 2 | 11 | % | |||||||||||||||||||||||||||||||||||
| Net revenues | 1,241 | 1,245 | (4) | — | %* | 1,154 | 87 | 8 | % | |||||||||||||||||||||||||||||||||||
| Fair value gains (losses), net | (83) | 16 | (99) | NM | 41 | (124) | NM | |||||||||||||||||||||||||||||||||||||
| Investment gains (losses), net | (20) | 19 | (39) | NM | (2) | (18) | NM | |||||||||||||||||||||||||||||||||||||
| Other gains (losses), net | (103) | 35 | (138) | NM | 39 | (142) | NM | |||||||||||||||||||||||||||||||||||||
| (Provision) benefit for credit losses | (174) | (5) | (169) | NM | — | (174) | NM | |||||||||||||||||||||||||||||||||||||
| Non-interest expense: | ||||||||||||||||||||||||||||||||||||||||||||
Administrative expenses(4) | (144) | (171) | 27 | 16 | % | (180) | 36 | 20 | % | |||||||||||||||||||||||||||||||||||
Legislative assessments(5) | (13) | (15) | 2 | 13 | % | (11) | (2) | (18) | % | |||||||||||||||||||||||||||||||||||
Credit enhancement expense(6) | (78) | (80) | 2 | 3 | % | (72) | (6) | (8) | % | |||||||||||||||||||||||||||||||||||
Other income (expense), net(7) | (59) | 27 | (86) | NM | (24) | (35) | (146) | % | ||||||||||||||||||||||||||||||||||||
| Total non-interest expense | (294) | (239) | (55) | (23) | % | (287) | (7) | (2) | % | |||||||||||||||||||||||||||||||||||
| Income before federal income taxes | 670 | 1,036 | (366) | (35) | % | 906 | (236) | (26) | % | |||||||||||||||||||||||||||||||||||
| Provision for federal income taxes | (124) | (186) | 62 | 33 | % | (163) | 39 | 24 | % | |||||||||||||||||||||||||||||||||||
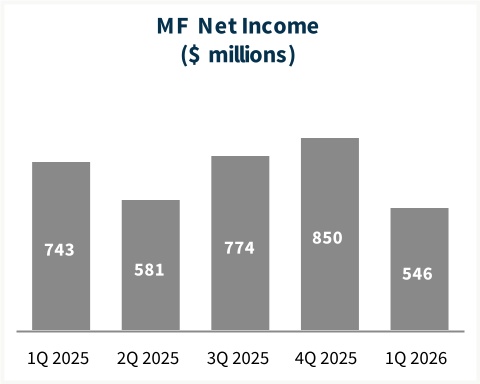
| Net income | $ | 546 | $ | 850 | $ | (304) | (36) | % | $ | 743 | $ | (197) | (27) | % | ||||||||||||||||||||||||||||||
| Average charged guaranty fee rate on multifamily guaranty book of business, at period end | 71.1 bps | 71.6 bps | (0.5) bps | (1) | % | 74.1 bps | (3.0) bps | (4) | % | |||||||||||||||||||||||||||||||||||
First Quarter 2026 | 4 | |||||||
| Additional Matters | ||
Fannie Mae’s Condensed Consolidated Balance Sheets and Condensed Consolidated Statements of Operations and Comprehensive Income for the first quarter of 2026 are available in the accompanying Annex; however, investors and interested parties should read the company’s quarterly report on Form 10-Q for the quarter ended March 31, 2026 (“First Quarter 2026 Form 10-Q”), which was filed today with the Securities and Exchange Commission and is available on Fannie Mae’s website, www.fanniemae.com. The company provides further discussion of its financial results and condition, credit performance, and other matters in its First Quarter 2026 Form 10-Q. Additional information about the company’s financial and credit performance is contained in Fannie Mae’s “1Q 2026 Earnings Presentation” and “First Quarter 2026 Financial Supplement” at www.fanniemae.com.
# # #
This release includes forward-looking statements regarding the company's future financial and mission performance and financial condition, as well as the company’s future plans, and their impact. Actual outcomes could be materially different from what is set forth in these forward-looking statements due to a variety of factors, including those described in “Forward-Looking Statements” in the company’s First Quarter 2026 Form 10-Q and in “Forward-Looking Statements,” “Risk Factors,” and elsewhere in the company’s annual report on Form 10-K for the year ended December 31, 2025.
Fannie Mae provides website addresses in its news releases solely for readers’ information. Information contained on or accessible through our website is not incorporated into, and does not as a result of references to the company’s website form a part of, this release or any other report or document the company files with or furnishes to the Securities and Exchange Commission, and any references to the company’s website are intended to be inactive textual references only.
To learn more, visit fanniemae.com.
| Endnotes | |||||
| NM | Not meaningful | ||||
| * | Represents less than 0.5% | ||||
| (1) | As presented in our Form 10-Q, net revenues consists of net interest income, and fee and other income. | ||||
| (2) | Illustrative return on average required Common Equity Tier 1 (CET1) is designed to show what our return on capital would have been if our actual CET1 available capital had been equal to the CET1 capital requirement for the applicable periods. CET1 requirement as presented represents the company's average CET1 capital requirement including prescribed capital conservation buffer amount under the enterprise regulatory capital framework (which is not currently in effect while the company is in conservatorship) for the period as described below and not the amount of the company's actual available CET1 capital. As of March 31, 2026, the company's actual available CET1 capital was a deficit of $37 billion. For each applicable period, the illustrative return on average required CET1 ratio is calculated based on annualized year-to-date net income for the period divided by the average CET1 capital requirement for each quarter to date during the applicable year plus the fourth quarter of the previous year. | ||||
| (3) | Administrative expense ratio is calculated as administrative expenses divided by net revenues during the period. Administrative expenses consist of salaries and employee benefits and professional services, technology and occupancy expenses. | ||||
| (4) | Consists of salaries and employee benefits and professional services, technology and occupancy expenses. | ||||
| (5) | For single-family, consists of the portion of our single-family guaranty fees that is paid to Treasury pursuant to the TCCA, affordable housing allocations and FHFA assessments. For multifamily, consists of affordable housing allocations and FHFA assessments. | ||||
| (6) | Consists of costs associated with freestanding credit enhancements, which primarily include the company’s Connecticut Avenue Securities® (“CAS”) and Credit Insurance Risk TransferTM programs, enterprise-paid mortgage insurance, and certain lender risk-sharing programs. | ||||
| (7) | Primarily consists of foreclosed property income (expense), change in the expected benefits from our freestanding credit enhancements, and gains (losses) from partnership investments. | ||||
| (8) | Single-family seriously delinquent loans are loans that are 90 days or more past due or in the foreclosure process. Our single-family serious delinquency rate is expressed as a percentage of our single-family conventional guaranty book of business based on loan count. | ||||
| (9) | Multifamily serious delinquency rate consists of multifamily loans that were 60 days or more past due based on unpaid principal balance, expressed as a percentage of our multifamily guaranty book of business. | ||||
Investor Contact: Yasaman Hekmat (yasaman_hekmat@fanniemae.com)
Media Contact: Matthew Classick (matthew_t_classick@fanniemae.com).
First Quarter 2026 | 5 | |||||||
ANNEX
FANNIE MAE
(In conservatorship)
Condensed Consolidated Statements of Operations and Comprehensive Income — (Unaudited)
(Dollars and shares in millions, except per share amounts)
| For the Three Months Ended March 31, | |||||||||||||||||||||||
| 2026 | 2025 | ||||||||||||||||||||||
| Interest income: | |||||||||||||||||||||||
| Mortgage loans | $ | 38,905 | $ | 37,399 | |||||||||||||||||||
| Securities purchased under agreements to resell | 630 | 872 | |||||||||||||||||||||
| Investments in securities and other | 687 | 745 | |||||||||||||||||||||
| Total interest income | 40,222 | 39,016 | |||||||||||||||||||||
| Interest expense: | |||||||||||||||||||||||
| Short-term debt | (194) | (105) | |||||||||||||||||||||
| Long-term debt | (32,830) | (31,910) | |||||||||||||||||||||
| Total interest expense | (33,024) | (32,015) | |||||||||||||||||||||
| Net interest income | 7,198 | 7,001 | |||||||||||||||||||||
| Fair value gains (losses), net | 121 | 123 | |||||||||||||||||||||
| Fee and other income | 82 | 84 | |||||||||||||||||||||
| Investment gains (losses), net | (277) | (1) | |||||||||||||||||||||
| Non-interest income | (74) | 206 | |||||||||||||||||||||
| (Provision) benefit for credit losses | (277) | (24) | |||||||||||||||||||||
| Non-interest expense: | |||||||||||||||||||||||
| Salaries and employee benefits | (463) | (611) | |||||||||||||||||||||
| Professional services, technology, and occupancy | (282) | (381) | |||||||||||||||||||||
| Legislative assessments | (931) | (931) | |||||||||||||||||||||
| Credit enhancement expense | (358) | (479) | |||||||||||||||||||||
| Other income (expense), net | (149) | (197) | |||||||||||||||||||||
| Total non-interest expense | (2,183) | (2,599) | |||||||||||||||||||||
| Income before federal income taxes | 4,664 | 4,584 | |||||||||||||||||||||
| Provision for federal income taxes | (944) | (923) | |||||||||||||||||||||
| Net income | 3,720 | 3,661 | |||||||||||||||||||||
| Other comprehensive income (loss) | (65) | (6) | |||||||||||||||||||||
| Total comprehensive income | $ | 3,655 | $ | 3,655 | |||||||||||||||||||
| Net income | $ | 3,720 | $ | 3,661 | |||||||||||||||||||
Dividends distributed or amounts attributable to senior preferred stock | (3,655) | (3,655) | |||||||||||||||||||||
| Net income (loss) attributable to common stockholders | $ | 65 | $ | 6 | |||||||||||||||||||
| Earnings per share: | |||||||||||||||||||||||
| Basic | $ | 0.01 | $ | 0.00 | |||||||||||||||||||
| Diluted | 0.01 | 0.00 | |||||||||||||||||||||
| Weighted-average common shares outstanding: | |||||||||||||||||||||||
| Basic | 5,867 | 5,867 | |||||||||||||||||||||
| Diluted | 5,893 | 5,893 | |||||||||||||||||||||
See Notes to Condensed Consolidated Financial Statements in the First Quarter 2026 Form 10-Q
First Quarter 2026 | 6 | |||||||
FANNIE MAE
(In conservatorship)
Condensed Consolidated Balance Sheets — (Unaudited)
(Dollars in millions)
| As of | |||||||||||||||||||||||
| March 31, 2026 | December 31, 2025 | ||||||||||||||||||||||
| ASSETS | |||||||||||||||||||||||
| Cash | $ | 11,485 | $ | 11,452 | |||||||||||||||||||
| Restricted cash (includes $26,323 and $22,848, respectively, related to consolidated trusts) | 33,779 | 31,131 | |||||||||||||||||||||
| Securities purchased under agreements to resell (includes $19,450 and $18,425, respectively, related to consolidated trusts) | 38,199 | 45,650 | |||||||||||||||||||||
| Investments in securities, at fair value | 75,520 | 69,889 | |||||||||||||||||||||
| Mortgage loans: | |||||||||||||||||||||||
Loans held for sale, at lower of cost or fair value | 199 | 209 | |||||||||||||||||||||
| Loans held for investment, at amortized cost: | |||||||||||||||||||||||
| Of Fannie Mae | 60,595 | 57,970 | |||||||||||||||||||||
| Of consolidated trusts | 4,062,863 | 4,069,498 | |||||||||||||||||||||
| Total loans held for investment (includes $5,547 and $5,464, respectively, at fair value) | 4,123,458 | 4,127,468 | |||||||||||||||||||||
| Allowance for loan losses | (8,357) | (8,364) | |||||||||||||||||||||
| Total loans held for investment, net of allowance | 4,115,101 | 4,119,104 | |||||||||||||||||||||
| Total mortgage loans | 4,115,300 | 4,119,313 | |||||||||||||||||||||
| Advances to lenders | 3,509 | 3,595 | |||||||||||||||||||||
| Deferred tax assets, net | 9,430 | 9,828 | |||||||||||||||||||||
| Accrued interest receivable (includes $11,275 and $11,129, respectively, related to consolidated trusts) | 11,915 | 11,689 | |||||||||||||||||||||
| Other assets | 15,498 | 14,991 | |||||||||||||||||||||
| Total assets | $ | 4,314,635 | $ | 4,317,538 | |||||||||||||||||||
| LIABILITIES AND EQUITY | |||||||||||||||||||||||
| Liabilities: | |||||||||||||||||||||||
| Accrued interest payable (includes $11,277 and $11,320, respectively, related to consolidated trusts) | $ | 12,213 | $ | 12,035 | |||||||||||||||||||
| Debt: | |||||||||||||||||||||||
| Of Fannie Mae (includes $265 and $256, respectively, at fair value) | 150,438 | 127,289 | |||||||||||||||||||||
| Of consolidated trusts (includes $13,707 and $15,060, respectively, at fair value) | 4,022,364 | 4,053,140 | |||||||||||||||||||||
| Other liabilities (includes $1,700 and $1,719, respectively, related to consolidated trusts) | 16,953 | 16,062 | |||||||||||||||||||||
| Total liabilities | 4,201,968 | 4,208,526 | |||||||||||||||||||||
| Commitments and contingencies (Note 14) | — | — | |||||||||||||||||||||
| Fannie Mae stockholders’ equity: | |||||||||||||||||||||||
| Senior preferred stock (liquidation preference of $230,511 and $226,984, respectively) | 120,836 | 120,836 | |||||||||||||||||||||
| Preferred stock, 700,000,000 shares are authorized—555,374,922 shares issued and outstanding | 19,130 | 19,130 | |||||||||||||||||||||
| Common stock, no par value, no maximum authorization—1,308,762,703 shares issued and 1,158,087,567 shares outstanding | 687 | 687 | |||||||||||||||||||||
| Accumulated deficit | (20,541) | (24,261) | |||||||||||||||||||||
| Accumulated other comprehensive income (loss) | (45) | 20 | |||||||||||||||||||||
| Treasury stock, at cost, 150,675,136 shares | (7,400) | (7,400) | |||||||||||||||||||||
Total stockholders’ equity | 112,667 | 109,012 | |||||||||||||||||||||
| Total liabilities and equity | $ | 4,314,635 | $ | 4,317,538 | |||||||||||||||||||
See Notes to Condensed Consolidated Financial Statements in the First Quarter 2026 Form 10-Q
First Quarter 2026 | 7 | |||||||

April 29, 2026 1Q 2026 Earnings Presentation © 2026 Fannie Mae Exhibit 99.2

The Endnotes provided on slides 16-18 are an integral part of this presentation. Also see slide 15 for key definitions used in this presentation and notices relating to forward-looking statements and additional information. 1 Special Colors #edebe9 #898989 #cff2f2 Categorical Color Palette #05314d #1c6fa3 #898989 #4d4d4d #5dc7d0 #c55422 #2c6937 For callout boxes Use in rounded shape Sequential Color Palette #121212 #05314d #085280 #1c6fa3 #509ed5 #98c6e6 Line graph Color Palette #c44786 (refrain from using) #085280 #5dc7d0 #898989 #e66e39 #418152 #ffb400 1Q 2026 Key Highlights Page align Top align Enhanced support of the secondary market through MBS purchases Delivered operational efficiency gains into financial results We are starting the year strong and focused on our purpose. $7.3B Net Revenues 1 $3.7B Net Income $112.7B Net Worth 2 Financial Performance Mission Performance $116B Liquidity provided to the mortgage market 385K Households helped to buy, refinance, or rent a home Execution Highlights Streamlined requirements and tools to better support business partners Bottom Exhibit 99.2

The Endnotes provided on slides 16-18 are an integral part of this presentation. Also see slide 15 for key definitions used in this presentation and notices relating to forward-looking statements and additional information. 2 Special Colors #edebe9 #898989 #cff2f2 Categorical Color Palette #05314d #1c6fa3 #898989 #4d4d4d #5dc7d0 #c55422 #2c6937 For callout boxes Use in rounded shape Sequential Color Palette #121212 #05314d #085280 #1c6fa3 #509ed5 #98c6e6 Line graph Color Palette #c44786 (refrain from using) #085280 #5dc7d0 #898989 #e66e39 #418152 #ffb400 $ Millions 1Q26 4Q25 + / (-) 1Q25 + / (-) Net revenues 1 $7,280 $7,331 $(51) (1) % $7,085 $195 3 % Other gains (losses), net 3 (156) (252) 96 38 122 (278) NM (Provision) / benefit for credit losses (277) (298) 21 7 (24) (253) NM Non-interest expense a (2,183) (2,371) 188 8 (2,599) 416 16 Pretax income 4,664 4,410 254 6 4,584 80 2 Tax provision (944) (883) (61) (7) (923) (21) (2) Net income $3,720 $3,527 $193 5 % $3,661 $59 2 % Total comprehensive income $3,655 $3,527 $128 4 % $3,655 $0 0 % Total assets ($B) $4,315 $4,318 $(3) 0 % $4,354 $(39) (1) % Net worth ($B) b $112.7 $109.0 $3.7 3.4 % $98.3 $14.4 14.6 % 1Q 2026 Financial Summary Key Metrics Guaranty Fees 4/ Net Revenues 1 0.67% Net Interest Margin 5 10.23% Administrative Expense Ratio 6 10.4%* Illustrative Return on Average Required CET1 7 (81.0% in 4Q25) (10.2%* in 4Q25) (0.68% in 4Q25) (12.56% in 4Q25) 81.4% $5.9B Guaranty Fees 4 ($5.9B in 4Q25) Page align Note: * YTD Annualized. a) See page 7 for the components of non-interest expense. b) Numbers may not sum due to rounding. Bottom Exhibit 99.2

The Endnotes provided on slides 16-18 are an integral part of this presentation. Also see slide 15 for key definitions used in this presentation and notices relating to forward-looking statements and additional information. 3 Special Colors #edebe9 #898989 #cff2f2 Categorical Color Palette #05314d #1c6fa3 #898989 #4d4d4d #5dc7d0 #c55422 #2c6937 For callout boxes Use in rounded shape Sequential Color Palette #121212 #05314d #085280 #1c6fa3 #509ed5 #98c6e6 Line graph Color Palette #c44786 (refrain from using) #085280 #5dc7d0 #898989 #e66e39 #418152 #ffb400 Guaranty Book & Net Interest Income Net Interest IncomeAverage Guaranty Book 8 $ Billions $ Billions $3,586 $3,635 $3,626 $3,593 $3,564 $425 $455 $483 $514 $539 $4,011 $4,090 $4,109 $4,107 $4,103 2022 2023 2024 2025 1Q26 Single-Family 9 Multifamily 10 $16.1 $16.2 $16.5 $17.0 $3.3 $3.4 $3.4 $3.4 $7.1 $4.0 $3.3 $3.2 $2.9 $5.2 $5.5 $5.0 $29.4 $28.8 $28.7 $28.6 $7.2 2022 2023 2024 2025 1Q26 Base Guaranty Fee 11 Deferred Guaranty Fee 12 Portfolios & Other 13TCCA 1Q26 QoQ 30-Year Fixed Mortgage Rate 14 △ ~24% of U.S. Single-Family Mortgage Debt Outstanding 16 ~21% of U.S. Multifamily Mortgage Debt Outstanding 16 QoQ Secured Overnight Financing Rate 15 △ Page align -19.0 bps+23.0 bps Our guaranty business continued to generate the majority of our net interest income. $1.3 $0.8 $0.9 $4.2 Exhibit 99.2

The Endnotes provided on slides 16-18 are an integral part of this presentation. Also see slide 15 for key definitions used in this presentation and notices relating to forward-looking statements and additional information. 4 Special Colors #edebe9 #898989 #cff2f2 Categorical Color Palette #05314d #1c6fa3 #898989 #4d4d4d #5dc7d0 #c55422 #2c6937 For callout boxes Use in rounded shape Sequential Color Palette #121212 #05314d #085280 #1c6fa3 #509ed5 #98c6e6 Line graph Color Palette #c44786 (refrain from using) #085280 #5dc7d0 #898989 #e66e39 #418152 #ffb400 67.1 63.5 63.6 62.3 67.8 72.9 69.3 66.9 66.9 66.5 67.3 44.0 45.4 45.8 46.4 47.8 49.3 49.7 50.2 50.8 51.4 51.7 41.5 42.1 42.7 43.4 44.4 45.7 46.2 46.9 47.6 48.4 48.8 74.9 78.7 75.4 71.8 74.5 78.4 78.5 76.1 74.4 71.6 71.1 2016 2017 2018 2019 2020 2021 2022 2023 2024 2025 1Q26 Net Interest Margin (NIM) Guaranty fees continued to anchor our stable margins. Basis Points Net Interest Margin 5 Avg. Single-Family Guaranty Fee 17 Avg. Multifamily Guaranty Fee 18 Avg. Total Book Guaranty Fee 19 Page align Exhibit 99.2

The Endnotes provided on slides 16-18 are an integral part of this presentation. Also see slide 15 for key definitions used in this presentation and notices relating to forward-looking statements and additional information. 5 Special Colors #edebe9 #898989 #cff2f2 Categorical Color Palette #05314d #1c6fa3 #898989 #4d4d4d #5dc7d0 #c55422 #2c6937 For callout boxes Use in rounded shape Sequential Color Palette #121212 #05314d #085280 #1c6fa3 #509ed5 #98c6e6 Line graph Color Palette #c44786 (refrain from using) #085280 #5dc7d0 #898989 #e66e39 #418152 #ffb400 0.90% 0.99% 1.00% 1.05% 0.94% 0.17% 0.13% 0.12% 0.10% 0.07% 1Q25 2Q25 3Q25 4Q25 1Q26 0.80% 0.78% 0.81% 0.88% 0.83% 0.63% 0.61% 0.68% 0.74% 0.78% 1Q25 2Q25 3Q25 4Q25 1Q26 Select Credit Metrics 30-Days Delinquent Seriously Delinquent 60+ Days Delinquent 0.56% 0.53% 0.54% 0.58% 0.58% 0.63% 0.61% 0.68% 0.74% 0.78% 1Q25 2Q25 3Q25 4Q25 1Q26 Multifamily delinquencies remain elevated following sustained market challenges. Page align Single-Family 20 Multifamily 21 Exhibit 99.2

The Endnotes provided on slides 16-18 are an integral part of this presentation. Also see slide 15 for key definitions used in this presentation and notices relating to forward-looking statements and additional information. 6 Special Colors #edebe9 #898989 #cff2f2 Categorical Color Palette #05314d #1c6fa3 #898989 #4d4d4d #5dc7d0 #c55422 #2c6937 For callout boxes Use in rounded shape Sequential Color Palette #121212 #05314d #085280 #1c6fa3 #509ed5 #98c6e6 Line graph Color Palette #c44786 (refrain from using) #085280 #5dc7d0 #898989 #e66e39 #418152 #ffb400 0.14% 0.16% 0.16% 0.17% 0.17% 0.47% 0.49% 0.46% 0.43% 0.42% 0.18% 0.20% 0.20% 0.20% 0.20% 1Q25 2Q25 3Q25 4Q25 1Q26 0.02% 0.01% 0.02% 0.01% 0.03% 0.07% 0.11% 0.07% 0.14% 0.02% 0.03% 0.02% 0.03% 1Q25 2Q25 3Q25 4Q25 1Q26 Allowance for Credit Losses Net Charge-Off Ratio 24 Credit Loss Reserves / Guaranty Book 23 Total Guaranty Book Single-Family Multifamily 0.01% Page align Top Bottom 1Q26 1Q25 $ Millions Single- Family Multi- family Total Single- Family Multi- family Total Allowance for credit losses 22 Beginning balance $(6,272) $(2,320) $(8,592) $(5,487) $(2,399) $(7,886) Write-offs 132 243 375 191 61 252 Recoveries (43) (55) (98) (36) (28) (64) Net Charge-Offs 89 188 277 155 33 188 (Provision) benefit for credit losses (103) (174) (277) (24) 0 (24) Allowance (build) / release (14) 14 0 131 33 164 Ending balance $(6,286) $(2,306) $(8,592) $(5,356) $(2,366) $(7,722) Exhibit 99.2

The Endnotes provided on slides 16-18 are an integral part of this presentation. Also see slide 15 for key definitions used in this presentation and notices relating to forward-looking statements and additional information. 7 Special Colors #edebe9 #898989 #cff2f2 Categorical Color Palette #05314d #1c6fa3 #898989 #4d4d4d #5dc7d0 #c55422 #2c6937 For callout boxes Use in rounded shape Sequential Color Palette #121212 #05314d #085280 #1c6fa3 #509ed5 #98c6e6 Line graph Color Palette #c44786 (refrain from using) #085280 #5dc7d0 #898989 #e66e39 #418152 #ffb400 Non-Interest Expense Our cost reduction efforts realized savings across expense categories. $ Millions 1Q26 4Q25 + / (-) 1Q25 + / (-) Salaries & benefits $(463) $(516) $53 10 % $(611) $148 24 % Professional services (103) (193) 90 47 (183) 80 44 Occupancy & technology (179) (212) 33 16 (198) 19 10 Administrative expenses (745) (921) 176 19 (992) 247 25 Legislative assessments (931) (936) 5 1 (931) 0 0 Credit enhancement (358) (368) 10 3 (479) 121 25 Other income (expense) 25 (149) (146) (3) (2) (197) 48 24 Total $(2,183) $(2,371) $188 8 % $(2,599) $416 16 % • Recent actions to reduce our workforce, contractors, and real estate footprint drove administrative expenses lower quarter-over-quarter and year-over-year • While our results may vary from quarter to quarter, we are committed to sustaining a smaller cost base by remaining focused on operational efficiency Administrative Expense Ratio 6 14.00% 11.70% 11.21% 12.56% 10.23% 1Q25 2Q25 3Q25 4Q25 1Q26 Page align Exhibit 99.2

The Endnotes provided on slides 16-18 are an integral part of this presentation. Also see slide 15 for key definitions used in this presentation and notices relating to forward-looking statements and additional information. 8 Special Colors #edebe9 #898989 #cff2f2 Categorical Color Palette #05314d #1c6fa3 #898989 #4d4d4d #5dc7d0 #c55422 #2c6937 For callout boxes Use in rounded shape Sequential Color Palette #121212 #05314d #085280 #1c6fa3 #509ed5 #98c6e6 Line graph Color Palette #c44786 (refrain from using) #085280 #5dc7d0 #898989 #e66e39 #418152 #ffb400 Regulatory Capital Risk-Weighted Assets (RWA) & Risk Density 27 $ Billions $ Billions CET1 Capital Requirements 26 Our CET1 capital requirement decreased slightly with a lower stability capital buffer. 26 Minimum Requirement Total CET1 / RWAStress Capital Buffer Stability Capital Buffer $60 $59 $62 $63 $65 $33 $33 $33 $33 $33 $47 $47 $47 $47 $44 $140 $139 $142 $143 $142 10.5% 10.6% 10.3% 10.2% 9.8% 1Q25 2Q25 3Q25 4Q25 1Q26 $1,333 $1,312 $1,372 $1,411 $1,450 29.9% 29.5% 30.9% 31.9% 32.8% 1Q25 2Q25 3Q25 4Q25 1Q26 Total RWA Risk Density 27 • RWA and risk density increased quarter-over-quarter reflecting market risk from retained mortgage portfolio growth, credit risk on new acquisitions, and reduced capital relief from credit risk transfer (CRT) • Our total CET1 capital requirement was 9.8% of RWA, or $142 billion, as of March 31, 2026 • The stability and stress capital buffers represented 54% of our total CET1 requirement • The stability capital buffer, which is calculated based on our share of mortgage debt outstanding, is $3 billion lower than 2025 levels based on the latest annual update Page align Exhibit 99.2

The Endnotes provided on slides 16-18 are an integral part of this presentation. Also see slide 15 for key definitions used in this presentation and notices relating to forward-looking statements and additional information. 9 Special Colors #edebe9 #898989 #cff2f2 Categorical Color Palette #05314d #1c6fa3 #898989 #4d4d4d #5dc7d0 #c55422 #2c6937 For callout boxes Use in rounded shape Sequential Color Palette #121212 #05314d #085280 #1c6fa3 #509ed5 #98c6e6 Line graph Color Palette #c44786 (refrain from using) #085280 #5dc7d0 #898989 #e66e39 #418152 #ffb400 $138 $142 $46 $51 $(74) $(18) 4Q22 1Q26 Net Worth $60 $113 Less : Senior Preferred Stock $121 $121 Less: Regulatory Capital Position Adjustments and Deductions 28 $13 $9 Adjusted Total Available Capital (Deficit) $(74) $(18) Net Worth and Regulatory Capital Growth in Net Worth 2 $13.5 $46.8 $60.3 $52.4 $112.7 Net Worth 1/1/2020 Cumulative Net Income 2020 - 4Q22 Net Worth 4Q22 Cumulative Net Income 2023 - 1Q26 Net Worth 1Q26 $ Billions $ Billions Progress Towards Regulatory Capital Requirements 26 CET1 Additional Tier 1 & 2 $105B Total Risk - Based Capital Minimum 30 $116B Total Risk- Based Capital Minimum 30 We have materially grown our net worth and meaningfully reduced our regulatory capital deficit. Adjusted Total Available Capital (Deficit) 4Q22 1Q26 $(258) $(211) Total Capital Shortfall $184 29 $193 29 Note: Totals may not sum due to rounding. +$56B Page align Exhibit 99.2

The Endnotes provided on slides 16-18 are an integral part of this presentation. Also see slide 15 for key definitions used in this presentation and notices relating to forward-looking statements and additional information. 10 Special Colors #edebe9 #898989 #cff2f2 Categorical Color Palette #05314d #1c6fa3 #898989 #4d4d4d #5dc7d0 #c55422 #2c6937 For callout boxes Use in rounded shape Sequential Color Palette #121212 #05314d #085280 #1c6fa3 #509ed5 #98c6e6 Line graph Color Palette #c44786 (refrain from using) #085280 #5dc7d0 #898989 #e66e39 #418152 #ffb400 $3,610 $3,597 $3,588 $3,577 $3,564 48.1 48.3 48.5 48.7 48.8 1Q25 2Q25 3Q25 4Q25 1Q26 $50 $64 $72 $60 $55 $7 $10 $9 $9 $11$7 $10 $9 $28 $33 $64 $84 $90 $97 $99 56.5 57.3 56.3 55.4 55.1 1Q25 2Q25 3Q25 4Q25 1Q26 $ Billions Single-Family At a Glance Purchase Average Guaranty Fee, net of TCCA (bps) 17Cash-Out Refinance Other Refinance Average UPB Average Guaranty Fee, Net of TCCA (bps) 17 Single-Family Guaranty Book 9 Single-Family Loan Acquisitions $ Billions $ Millions 1Q26 4Q25 + / (-) 1Q25 + / (-) Net revenues 1 $6,039 $6,086 $(47) (1) % $5,931 $108 2 % Other gains (losses), net 3 (53) (287) 234 82 83 (136) NM (Provision) / benefit for credit losses (103) (293) 190 65 (24) (79) NM Non-interest expense (1,889) (2,132) 243 11 (2,312) 423 18 Pretax income 3,994 3,374 620 18 3,678 316 9 Tax provision (820) (697) (123) (18) (760) (60) (8) Net income $3,174 $2,677 $497 19 % $2,918 $256 9 % Single-Family Highlights Page align • Single-family acquisitions in the first quarter reached the highest levels in over three years, driven by lower mortgage rates and higher refinance activity • The Single-Family business delivered higher net income quarter-over- quarter and year-over-year, supported by significant reductions in non- interest expense Exhibit 99.2

The Endnotes provided on slides 16-18 are an integral part of this presentation. Also see slide 15 for key definitions used in this presentation and notices relating to forward-looking statements and additional information. 11 Special Colors #edebe9 #898989 #cff2f2 Categorical Color Palette #05314d #1c6fa3 #898989 #4d4d4d #5dc7d0 #c55422 #2c6937 For callout boxes Use in rounded shape Sequential Color Palette #121212 #05314d #085280 #1c6fa3 #509ed5 #98c6e6 Line graph Color Palette #c44786 (refrain from using) #085280 #5dc7d0 #898989 #e66e39 #418152 #ffb400 21% 32% 31% 28% 21% 7% 3% 3% 3% 4%4% 1% 2% 5% 9% 32% 36% 36% 36% 34% 2022 2023 2024 2025 1Q26 75% 78% 77% 77% 76% 5.0% 6.0% 7.0% 6.0% 6.0% 2022 2023 2024 2025 1Q26 747 755 758 757 757 8.0% 6.0% 5.0% 6.0% 7.0% 2022 2023 2024 2025 1Q26 FICO Credit Score 31 Original Loan-to-Value Ratio DTI Ratio > 43% 32 % FICO < 680Weighted-Average FICO Score % OLTV > 95%Weighted-Average OLTV Credit Characteristics of Single-Family Acquisitions Purchases Cash-Out Refinance Other Refinance Total Page align Our underwriting is sound and we have not sacrificed credit quality. Exhibit 99.2

The Endnotes provided on slides 16-18 are an integral part of this presentation. Also see slide 15 for key definitions used in this presentation and notices relating to forward-looking statements and additional information. 12 Special Colors #edebe9 #898989 #cff2f2 Categorical Color Palette #05314d #1c6fa3 #898989 #4d4d4d #5dc7d0 #c55422 #2c6937 For callout boxes Use in rounded shape Sequential Color Palette #121212 #05314d #085280 #1c6fa3 #509ed5 #98c6e6 Line graph Color Palette #c44786 (refrain from using) #085280 #5dc7d0 #898989 #e66e39 #418152 #ffb400 $505 $511 $521 $535 $542 74.1 73.3 72.4 71.6 71.1 1Q25 2Q25 3Q25 4Q25 1Q26 Multifamily At a Glance Multifamily Guaranty Book 10 $ Millions 1Q26 4Q25 + / (-) 1Q25 + / (-) Net revenues 1 $1,241 $1,245 $(4) 0 % $1,154 $87 8 % Other gains (losses), net 3 (103) 35 (138) NM 39 (142) NM (Provision) / benefit for credit losses (174) (5) (169) NM 0 (174) NM Non-interest expense (294) (239) (55) (23) (287) (7) (2) Pretax income 670 1,036 (366) (35) 906 (236) (26) Tax provision (124) (186) 62 33 (163) 39 24 Net income $546 $850 $(304) (36) % $743 $(197) (27) % $11.8 $17.4 $18.7 $25.8 $17.1 1Q25 2Q25 3Q25 4Q25 1Q26 Fixed-rate Multifamily New Business Volume Variable-rate $ Billions $ Billions UPB Outstanding Average Guaranty Fee (bps) 18 Multifamily Highlights Page align • Multifamily new business volumes were higher than the same period last year, driving the total guaranty book higher to $542 billion • Despite the continued strength of net revenues, multifamily net income was lower quarter-over-quarter and year-over-year, primarily due to a higher first quarter provision for credit losses and a shift to other losses Exhibit 99.2

The Endnotes provided on slides 16-18 are an integral part of this presentation. Also see slide 15 for key definitions used in this presentation and notices relating to forward-looking statements and additional information. 13 Special Colors #edebe9 #898989 #cff2f2 Categorical Color Palette #05314d #1c6fa3 #898989 #4d4d4d #5dc7d0 #c55422 #2c6937 For callout boxes Use in rounded shape Sequential Color Palette #121212 #05314d #085280 #1c6fa3 #509ed5 #98c6e6 Line graph Color Palette #c44786 (refrain from using) #085280 #5dc7d0 #898989 #e66e39 #418152 #ffb400 Multifamily Credit Characteristics & Credit Enhancement 86% 93% 89% 88% 88% 14% 6% 11% 11% 11% 59% 59% 62% 62% 63% 2022 2023 2024 2025 1Q26 2.2 2.0 2.0 1.9 1.9 64% 63% 63% 63% 63% 2022 2023 2024 2025 1Q26 Original Loan-to-Value Ratio of Acquisitions Guaranty Book Credit Metrics 10 $112.8 $138.0 $157.3 $172.8 $170.8 $87.7 $89.5 $101.2 $105.8 $104.3 $25.1 $48.5 $56.1 $67.0 $66.5 26% 29% 31% 32% 31% 2022 2023 2024 2025 1Q26 Multifamily Guaranty Book with Loss ShareMultifamily Credit Risk Transfer 99% 99% 99% 100% 100% 99% 99% 99% 99% 99% 2022 2023 2024 2025 1Q26 Weighted-Average DSCR 33 Weighted-Average OLTV Ratio % OLTV > 80% Weighted-Average OLTV Ratio% OLTV < 70% % OLTV > 70% and < 80% % Multifamily in CRT TransactionUPB in MCIRT Transaction UPB in MCAS Transaction % Lender Recourse 34 % DUS 35 $ Billions Page align Exhibit 99.2

The Endnotes provided on slides 16-18 are an integral part of this presentation. Also see slide 15 for key definitions used in this presentation and notices relating to forward-looking statements and additional information. 14 Special Colors #edebe9 #898989 #cff2f2 Categorical Color Palette #05314d #1c6fa3 #898989 #4d4d4d #5dc7d0 #c55422 #2c6937 For callout boxes Use in rounded shape Sequential Color Palette #121212 #05314d #085280 #1c6fa3 #509ed5 #98c6e6 Line graph Color Palette #c44786 (refrain from using) #085280 #5dc7d0 #898989 #e66e39 #418152 #ffb400 $13.4 $12.3 $12.1 $11.4 $11.5 $56.6 $48.1 $45.5 $27.2 $18.7 $77.9 $75.8 $66.1 $55.2 $56.3 $147.9 $136.2 $123.7 $93.8 $86.5 3.5% 3.6% 3.6% 3.5% 3.3% 1Q25 2Q25 3Q25 4Q25 1Q26 $92.4 $85.6 $72.6 $61.8 $90.1 $33.4 $31.6 $33.9 $41.0 $39.7 $11.0 $11.1 $19.9 $24.5 $20.6 $136.8 $128.3 $126.4 $127.3 $150.4 3.4% 3.6% 3.9% 3.8% 3.7% 1Q25 2Q25 3Q25 4Q25 1Q26 Cash Repo 36 U.S. Treasuries Debt Portfolio 37 Long-Term Debt >1 Yr Maturity Long-Term Debt <1 Yr Maturity Short-Term Debt Corporate Liquidity Portfolio Cost of DebtYield $ Billions $ Billions $32.4 $35.8 $47.4 $78.3 $111.5$42.3 $43.4 $46.2 $48.6 $51.6 $80.3 $84.8 $98.8 $132.5 $168.74.1% 4.3% 4.4% 4.4% 4.4% 1Q25 2Q25 3Q25 4Q25 1Q26 $ Billions Agency MBS & Lender Liquidity Loss Mitigation Other Retained Mortgage Portfolio 38 Yield Balance Sheet & Fannie Mae Debt Portfolios Page align We effectively managed our balance sheet as we increased our net worth. $5.6 $5.6 $5.2 $5.6 $5.6 Exhibit 99.2

DRAFT 15 BPS: Basis points CET1: Common Equity Tier 1 CRT: Credit risk transfer DSCR: Debt service coverage ratio DTI ratio: Debt-to-income ("DTI") ratio refers to the ratio of a borrower's outstanding debt obligations (including both mortgage debt and certain other long-term and significant short-term debts) to that borrower's reported or calculated monthly income, to the extent the income is used to qualify for the mortgage DUS®: Fannie Mae's Delegated Underwriting and Servicing program NM: Not meaningful MBS: Mortgage-backed securities MCAS™: Multifamily Connecticut Avenue Securities® MCIRT™: Multifamily Credit Insurance Risk Transfer™ OLTV ratio: Original loan-to-value ratio, which refers to the unpaid principal balance of a loan at the time of origination of the loan, divided by the home price or property value at origination of the loan TCCA: Refers to revenues generated by the 10 basis point guaranty fee increase the company implemented on single-family residential mortgages pursuant to the Temporary Payroll Tax Cut Continuation Act of 2011 ("TCCA") and as extended by the Infrastructure Investment and Jobs Act, the incremental revenue from which is paid to Treasury and not retained by the company UPB: Unpaid principal balance Definitions Forward-looking statements. This presentation includes forward-looking statements regarding the company's future financial and credit performance, as well as the company's future plans and their impact. Actual outcomes could be materially different from what is set forth in these forward-looking statements due to a variety of factors, including those described in “Forward-Looking Statements” in the company’s quarterly report on Form 10-Q for the quarter ended March 31, 2026 ("Q1 2026 Form 10-Q") and in “Forward-Looking Statements” and “Risk Factors” in the company’s annual report on Form 10-K for the year ended December 31, 2025 (“2025 Form 10-K”). Additional Information. Some of the terms and other information in this presentation are defined and discussed more fully in the company's applicable Form 10-Q and Form 10-K filings. This presentation should be reviewed together with the Q1 2026 Form 10-Q and the 2025 Form 10-K, which is available at www.fanniemae.com in the “About Us—Investor Relations—SEC Filings” section. Information on or available through the company's website is not part of this presentation, and does not as a result of references to the company’s website form a part of this presentation or any other report or document the company files with or furnishes to the Securities and Exchange Commission, and any references to the company’s website are intended to be inactive textual references only. Some of the information in this presentation is based upon information from third-party sources such as sellers and servicers of mortgage loans. Although Fannie Mae generally considers this information reliable, Fannie Mae does not independently verify all reported information. Due to rounding, amounts reported in this presentation may not sum to totals indicated (i.e., 100%), or amounts shown as 100% may not reflect the entire population. Unless otherwise indicated, data is as of March 31, 2026 or for the first quarter of 2026. Unless otherwise indicated, data for prior years is as of December 31 or for the full year indicated. Exhibit 99.2

DRAFT 16 1 As presented in our Form 10-Q, net revenues consists of net interest income, and fee and other income. 2 Net worth is also reported as stockholders' equity on the company's financial statements prepared in accordance with U.S. generally accepted accounting principles. 3 As presented in our Form 10-Q, other gains (losses), net consists of fair value gains (losses), net and investment gains (losses), net. 4 Guaranty fees represent net interest income from the company's guaranty book of business, which excludes net interest income from the retained mortgage portfolio, net interest income from the corporate liquidity portfolio, and income (expense) from hedge accounting. 5 Net interest margin is calculated based on annual net interest income for full-year results and annualized quarterly net interest income for quarterly results, in each case as a percentage of average total interest-earning assets during the applicable period. For additional information, refer to “MD&A—Consolidated Results of Operations—Net Interest Income—Analysis of Net Interest Income” in the company's applicable Form 10-Q and Form 10-K filings. 6 Administrative expense ratio is calculated as administrative expenses divided by net revenues during the period. Administrative expenses consist of salaries and employee benefits and professional services, technology and occupancy expenses. 7 Illustrative return on average required Common Equity Tier 1 (CET1) is designed to show what our return on capital would have been if our actual CET1 available capital had been equal to the CET1 capital requirement for the applicable periods. CET1 requirement as presented represents the company's average CET1 capital requirement including prescribed capital conservation buffer amount under the enterprise regulatory capital framework (which is not currently in effect while the company is in conservatorship) for the period as described below and not the amount of the company's actual available CET1 capital. As of March 31, 2026, the company's actual available CET1 capital was a deficit of $37 billion. For each applicable period, the illustrative return on average required CET1 ratio is calculated based on annualized year-to-date net income for the period divided by the average CET1 capital requirement for each quarter to date during the applicable year plus the fourth quarter of the previous year. 8 Average guaranty book represents our single-family conventional guaranty book of business, our multifamily guaranty book of business, or the combination of our single-family and multifamily books of business, as applicable, based on the unpaid principal balance of mortgage loans underlying our mortgage-backed securities. 9 Single-family guaranty book refers to our single-family conventional guaranty book of business, which consists of: (a) single-family conventional mortgage loans of Fannie Mae and (b) single-family conventional mortgage loans underlying Fannie Mae MBS other than loans underlying Freddie Mac securities that Fannie Mae has resecuritized. It excludes non-Fannie Mae single-family mortgage-related securities held in the retained mortgage portfolio for which Fannie Mae does not provide a guaranty. Conventional refers to mortgage loans and mortgage-related securities that are not guaranteed or insured, in whole or in part, by the U.S. government or one of its agencies. 10 Multifamily guaranty book refers to our multifamily guaranty book of business, which consists of: (a) multifamily mortgage loans of Fannie Mae; (b) multifamily mortgage loans underlying Fannie Mae MBS; and (c) other credit enhancements that the company provided on multifamily mortgage assets. It excludes non-Fannie Mae multifamily mortgage-related securities held in the retained mortgage portfolio for which Fannie Mae does not provide a guaranty. 11 Base guaranty fee refers to net interest income from the guaranty book of business, excluding the impact of TCCA and deferred guaranty fees. 12 Deferred guaranty fee refers to income recognized during the period primarily from the upfront fees that the company received at the time of loan acquisition related to single-family loan-level price adjustments or other fees the company received from lenders, which are amortized over the contractual life of the loan. Deferred guaranty fee income also includes the amortization of cost basis adjustments on mortgage loans and debt of consolidated trusts that are not associated with upfront fees. 13 Net interest income from portfolios and other consists of: interest income from assets held in the company's retained mortgage portfolio and corporate liquidity portfolio; interest income from other assets used to support agency MBS and lender liquidity; and interest expense on the company's outstanding funding debt. For purposes of this Earnings presentation chart, income (expense) from hedge accounting is included in the “Portfolios & Other” category; however, the company does not consider income (expense) from hedge accounting to be a component of net interest income from portfolios. The company had $173 million in hedge accounting expense for the three months ended March 31, 2026. 14 Based on the U.S. weekly average fixed-rate mortgage rate according to Freddie Mac’s Primary Mortgage Market Survey®. These rates are reported using the latest available data for a given period. 15 Based on the daily rate per the Federal Reserve Bank of New York. 16 Represents the company's share of single-family or multifamily estimated U.S. mortgage debt outstanding as of December 31, 2025 (the latest date for which information is available). 17 Average single-family guaranty fee represents, on an annualized basis, the average of the base guaranty fees charged weighted by unpaid principal balance during the period for the company's single-family conventional guaranty arrangements plus the recognition of any upfront cash payments relating to these guaranty arrangements based on an estimated average life at the time of acquisition (in basis points). Excludes the impact of TCCA. Endnotes Exhibit 99.2

DRAFT 17 18 Average charged guaranty fee rate on multifamily guaranty book of business (in basis points), at end of period. 19 To derive the average total book guaranty fee, the average single-family and multifamily guaranty fees are weighted based on the size of the segment’s guaranty book of business. 20 Single-family seriously delinquent, 30-days delinquent, and 60+ days delinquent loan percentages are each expressed as a percentage of our single-family conventional guaranty book of business, based on loan count. Single-family seriously delinquent loans are loans that are 90 days or more past due or in the foreclosure process. Single-family 60+ days delinquent loans are loans that are 60 days or more past due or in the foreclosure process. Single-family 30-days delinquent loans are loans that are 30-59 days delinquent. We revised our presentations of these single-family delinquency percentages in this Earnings Presentation to base them on loan count, which management uses to monitor the business, rather than unpaid principal balance. 21 Multifamily seriously delinquent, 30-days delinquent, and 60+ days delinquent loan percentages are expressed as a percentage of our multifamily guaranty book of business, based on unpaid principal balance. Multifamily seriously delinquent and 60 + days delinquent loans are loans that are 60 days or more past due. Multifamily 30-days delinquent loans are loans that are 30-59 days delinquent. 22 The company's allowance for credit losses consists of allowance for loan losses, allowance for credit losses on advances of pre-foreclosure costs, accrued interest receivable, our guaranty loss reserves and credit reserves on our available-for-sale (“AFS”) debt securities. Pre-foreclosure costs represent advances for property taxes and insurance receivables. For additional information about the company's allowance, refer to “Note 5, Allowance for Credit Losses” in the company's applicable Form 10-Q and Form 10-K filings. 23 The company's single-family, multifamily or total allowance for credit losses as a percentage of the company's single-family conventional, multifamily or total guaranty books of business. Credit loss reserves include the allowance for loan losses, allowance for accrued interest receivable, and reserve for guaranty losses. Credit loss reserves exclude reserves for advances of pre-foreclosure costs and the allowance for available-for-sale securities. Multifamily allowance for credit losses excludes the expected benefit of freestanding credit enhancements on multifamily loans, which are recorded in “Other assets” in the company's consolidated balance sheets. For additional information, refer to “MD&A—Consolidated Credit Ratios and Select Credit Information” in the company’s applicable Form 10-Q and Form 10-K filings. 24 The net charge-off ratio is based on annualized write-offs, net of recoveries, for single-family, multifamily, or total; write-offs occur when a loan is determined to be uncollectible or upon the redesignation of single-family mortgage loans from held for investment to held for sale, as a percentage of the average aggregate unpaid principal balance of the single-family conventional, multifamily, or total guaranty books of business during the period. The net charge-off ratio is based on write-offs net of recoveries on the company’s mortgage loans, accrued interest receivable and guaranty obligations. It excludes net charge-offs on advances of pre-foreclosure costs and available-for-sale securities. For additional information, refer to “MD&A—Consolidated Credit Ratios and Select Credit Information” in the company's applicable Form 10-Q and Form 10-K filings. 25 Other income (expense) consists of foreclosed property income (expense), gains (losses) from partnership investments, and change in expected credit enhancement recoveries. 26 The company began reporting its capital position under the enterprise regulatory capital framework beginning with the quarterly period ended December 31, 2022. The enterprise regulatory capital framework has a transition period for compliance, as described in the company's 2025 Form 10-K. While the company is in conservatorship, the company is not required to comply with the minimum capital or buffer requirements. 27 Risk density is calculated by dividing risk-weighted assets by adjusted total assets, in each case as defined by the enterprise regulatory capital framework. 28 Represents deferred tax assets arising from temporary differences that exceed 10% of common equity tier 1 capital and other regulatory adjustments. 29 Represents total adjusted risk-based capital requirements including buffers. 30 Minimum capital requirement does not include buffers. 31 FICO credit score is as of loan origination, as reported by the seller of the mortgage loan. 32 Excludes loans for which this information is not readily available. From time to time, the company revises its guidelines for determining a borrower's DTI ratio. The amount of income reported by a borrower and used to qualify for a mortgage may not represent the borrower's total income; therefore, the DTI ratios reported may be higher than borrowers' actual DTI ratios. 33 Estimates of current DSCRs are based on the latest available income information covering a 12-month period, from quarterly and annual statements for these properties including the related debt service. When an annual statement is the latest statement available, it is used. When operating statement information is not available, the underwritten DSCR is used. Co-op loans are excluded from this metric. 34 Represents the percentage of the company's multifamily guaranty book with lender risk-sharing agreements in place, measured by UPB for the period. 35 Under the Delegated Underwriting and Servicing (“DUS”) program, Fannie Mae acquires individual, newly originated mortgages from specially approved DUS lenders using DUS underwriting standards and/or DUS loan documents. We delegate to these lenders the authority to underwrite and service multifamily loans on our behalf in accordance with our standards and requirements, and DUS lenders typically share a portion of the credit risk on our multifamily loans for the life of the loans. 36 Represents securities purchased under agreements to resell. Endnotes Exhibit 99.2

DRAFT 18 Endnotes 37 Debt portfolio represents outstanding debt of Fannie Mae, which consists of the unpaid principal balance, premiums and discounts, fair value adjustments, hedge-related basis adjustments and other cost basis adjustments. Cost of debt is based on the weighted-average interest rates at period end, and excludes the effect of fair value adjustments and hedge-related basis. For additional information about the cost of debt, refer to “MD&A—Liquidity and Capital Management—Liquidity Management—Debt Funding” in the company's applicable Form 10-Q and Form 10-K filings. 38 Consists of mortgage loans and mortgage-related securities that the company owns, including Fannie Mae MBS and non-Fannie Mae mortgage-related securities. Assets held by consolidated MBS trusts that back mortgage-related securities owned by third parties are not included in the retained mortgage portfolio. The company classifies its retained mortgage portfolio into three categories: agency MBS & lender liquidity, loss mitigation and other. These categories are described in “MD&A—Retained Mortgage Portfolio” in the company's applicable Form 10-Q and Form 10-K filings. Exhibit 99.2

Exhibit 99.2

© 2026 Fannie Mae April 29, 2026 FIRST QUARTER 2026 FINANCIAL SUPPLEMENT Exhibit 99.3

TABLE OF CONTENTS Page Consolidated Results Selected Financial Data 1 Condensed Consolidated Statements of Income 2 Condensed Consolidated Balance Sheets 3 Average Balances of Assets & Liabilities and Annualized Yields 4 Credit-Related Information 5 Regulatory Capital 6 Business Segment Results Single-Family 7 Multifamily 11 © 2026 Fannie Mae Some of the terms and other information in this presentation are defined and discussed more fully in Fannie Mae’s Form 10-Q for the quarter ended March 31, 2026 ("Q1 2026 Form 10-Q") and Form 10-K for the year ended December 31, 2025 (“2025 Form 10-K”). This presentation should be reviewed together with the Q1 2026 Form 10-Q and the 2025 Form 10-K, which are available at www.fanniemae.com in the “About Us—Investor Relations—SEC Filings” section. Information on or available through the company's website is not part of this supplement, and does not as a result of references to the company's website form a part of this supplement or any other report or document the company files with or furnishes to the Securities and Exchange Commission, and any references to the company's website are intended to be inactive textual references only. Some of the information in this presentation is based upon information from third-party sources such as sellers and servicers of mortgage loans. Although Fannie Mae generally considers this information reliable, Fannie Mae does not independently verify all reported information. Due to rounding, amounts reported in this presentation may not sum to totals indicated (i.e., 100%), or amounts shown as 100% may not reflect the entire population. Unless otherwise indicated, data is as of March 31, 2026 or for the first quarter of 2026. Data for prior years is as of December 31 or for the full year indicated.

Q1 2026 Q4 2025 Q3 2025 Q2 2025 Q1 2025 Q4 2025 Q1 2025 $7,198 $7,268 $7,184 $7,155 $7,001 $(70) $197 82 63 123 86 84 19 (2) 7,280 7,331 7,307 7,241 7,085 (51) 195 121 (257) 13 211 123 378 (2) (277) 5 120 (19) (1) (282) (276) (156) (252) 133 192 122 96 (278) (277) (298) (338) (946) (24) 21 (253) (2,183) (2,371) (2,267) (2,333) (2,599) 188 416 4,664 4,410 4,835 4,154 4,584 254 80 (944) (883) (976) (837) (923) (61) (21) $3,720 $3,527 $3,859 $3,317 $3,661 $193 $59 $3,655 $3,527 $3,849 $3,324 $3,655 $128 $0 $11,485 $11,452 $12,155 $12,304 $13,401 $33 $(1,916) 38,199 45,650 61,525 63,878 71,495 (7,451) (33,296) 75,520 69,889 71,656 77,430 79,347 5,631 (3,827) 4,123,657 4,127,677 4,131,636 4,128,378 4,134,708 (4,020) (11,051) (8,357) (8,364) (8,246) (8,247) (7,532) 7 (825) $4,314,635 $4,317,538 $4,335,856 $4,338,227 $4,353,709 $(2,903) $(39,074) 150,438 127,289 126,390 128,316 136,818 23,149 13,620 4,022,364 4,053,140 4,076,945 4,082,196 4,091,840 (30,776) (69,476) $4,201,968 $4,208,526 $4,230,371 $4,236,591 $4,255,397 $(6,558) $(53,429) $112,667 $109,012 $105,485 $101,636 $98,312 $3,655 $14,355 $112,667 $109,012 $105,485 $101,636 $98,312 $3,655 $14,355 2.6 % 2.5 % 2.4 % 2.3 % 2.3 % 10.23 % 12.56 % 11.21 % 11.70 % 14.00 % 20.2 % 20.0 % 20.2 % 20.1 % 20.1 % (a) (b) (c) FANNIE MAE SELECTED FINANCIAL DATA ($ in millions, except ratio data) SELECTED INCOME STATEMENT DATA QUARTERLY DATA Q1 2026 Variance vs. Fair value gains (losses), net Net revenues Net interest income Fee and other income Investment gains (losses), net Other gains (losses), net (Provision) benefit for credit losses Non-interest expense(a) Net income Total comprehensive income Provision for federal income taxes Income before federal income taxes Securities purchased under agreements to resell Cash SELECTED BALANCE SHEET DATA (period-end) Investments in securities, at fair value Mortgage loans held for investment and held for sale Allowance for loan losses Total assets Total liabilities Total stockholders’ equity Debt of Consolidated Trusts Debt of Fannie Mae Net worth OTHER METRICS Administrative expense ratio(c) Effective income tax rate © 2026 Fannie Mae Net worth ratio is calculated based on net worth divided by total assets outstanding at the end of the period. Administrative expense ratio is calculated as administrative expenses divided by net revenues during the period. Administrative expenses consist of salaries and employee benefits and professional services, technology and occupancy expense. Consists of salaries and employee benefits, professional services, technology and occupancy expense, legislative assessments, credit enhancement expense and other income (expense), net. Net worth ratio(b) 1

Q1 2026 Q4 2025 Q3 2025 Q2 2025 Q1 2025 Q4 2025 Q1 2025 $38,905 $38,713 $38,344 $37,693 $37,399 $192 $1,506 630 714 844 924 872 (84) (242) 687 787 789 794 745 (100) (58) 40,222 40,214 39,977 39,411 39,016 8 1,206 (194) (223) (154) (103) (105) 29 (89) (32,830) (32,723) (32,639) (32,153) (31,910) (107) (920) (33,024) (32,946) (32,793) (32,256) (32,015) (78) (1,009) 7,198 7,268 7,184 7,155 7,001 (70) 197 121 (257) 13 211 123 378 (2) 82 63 123 86 84 19 (2) (277) 5 120 (19) (1) (282) (276) (74) (189) 256 278 206 115 (280) (277) (298) (338) (946) (24) 21 (253) (463) (516) (475) (492) (611) 53 148 (282) (405) (344) (355) (381) 123 99 (931) (936) (943) (939) (931) 5 0 (358) (368) (409) (400) (479) 10 121 (149) (146) (96) (147) (197) (3) 48 (2,183) (2,371) (2,267) (2,333) (2,599) 188 416 4,664 4,410 4,835 4,154 4,584 254 80 (944) (883) (976) (837) (923) (61) (21) 3,720 3,527 3,859 3,317 3,661 193 59 (65) 0 (10) 7 (6) (65) (59) $3,655 $3,527 $3,849 $3,324 $3,655 $128 $0 3,720 3,527 3,859 3,317 3,661 193 59 (3,655) (3,527) (3,849) (3,324) (3,655) (128) 0 $65 $0 $10 $(7) $6 $65 $59 $0.01 $0.00 $0.00 $0.00 $0.00 $0.01 $0.01 0.01 0.00 0.00 0.00 0.00 0.01 0.01 5,867 5,867 5,867 5,867 5,867 0 0 5,893 5,893 5,893 5,867 5,893 0 0 CONDENSED CONSOLIDATED STATEMENTS OF INCOME FANNIE MAE ($ and shares in millions, except per share data) Q1 2026 Variance vs. QUARTERLY DATA Mortgage loans Interest income: Securities purchased under agreements to resell Investments in securities and other Interest expense: Total interest income Long-term debt Short-term debt Total interest expense Net interest income Fair value gains (losses), net Non-interest income: Investment gains (losses), net Fee and other income Non-interest income (Provision) benefit for credit losses Salaries and employee benefits Non-interest expense: Legislative assessments Professional services, technology, and occupancy Credit enhancement expense Other income (expense), net Income before federal income taxes Non-interest expense Net income Provision for federal income taxes Other comprehensive income (loss) Total comprehensive income Dividends distributed or amounts attributable to senior preferred stock Net income Net income (loss) attributable to common stockholders EARNINGS PER SHARE DATA Earnings per share: Diluted Basic Basic Average shares: Diluted © 2026 Fannie Mae See Notes to the Condensed Consolidated Financial Statements in the First Quarter 2026 Form 10-Q 2

Q1 2026 Q4 2025 Q3 2025 Q2 2025 Q1 2025 Q4 2025 Q1 2025 $11,485 $11,452 $12,155 $12,304 $13,401 $33 $(1,916) 33,779 31,131 27,220 26,123 24,670 2,648 9,109 38,199 45,650 61,525 63,878 71,495 (7,451) (33,296) 75,520 69,889 71,656 77,430 79,347 5,631 (3,827) 199 209 808 393 775 (10) (576) 60,595 57,970 53,765 51,905 47,425 2,625 13,170 4,062,863 4,069,498 4,077,063 4,076,080 4,086,508 (6,635) (23,645) 4,123,458 4,127,468 4,130,828 4,127,985 4,133,933 (4,010) (10,475) (8,357) (8,364) (8,246) (8,247) (7,532) 7 (825) 4,115,101 4,119,104 4,122,582 4,119,738 4,126,401 (4,003) (11,300) 4,115,300 4,119,313 4,123,390 4,120,131 4,127,176 (4,013) (11,876) 3,509 3,595 3,227 2,211 1,848 (86) 1,661 9,430 9,828 10,000 10,127 10,453 (398) (1,023) 11,915 11,689 11,901 11,678 11,592 226 323 15,498 14,991 14,782 14,345 13,727 507 1,771 Total assets $4,314,635 $4,317,538 $4,335,856 $4,338,227 $4,353,709 $(2,903) $(39,074) $12,213 $12,035 $12,080 $11,841 $11,902 $178 $311 150,438 127,289 126,390 128,316 136,818 23,149 13,620 4,022,364 4,053,140 4,076,945 4,082,196 4,091,840 (30,776) (69,476) 16,953 16,062 14,956 14,238 14,837 891 2,116 Total liabilities $4,201,968 $4,208,526 $4,230,371 $4,236,591 $4,255,397 $(6,558) $(53,429) $120,836 $120,836 $120,836 $120,836 $120,836 $0 $0 19,130 19,130 19,130 19,130 19,130 0 0 687 687 687 687 687 0 0 (20,541) (24,261) (27,788) (31,647) (34,964) 3,720 14,423 (45) 20 20 30 23 (65) (68) (7,400) (7,400) (7,400) (7,400) (7,400) 0 0 Total stockholders' equity 112,667 109,012 105,485 101,636 98,312 3,655 14,355 Total liabilities & stockholders' equity $4,314,635 $4,317,538 $4,335,856 $4,338,227 $4,353,709 $(2,903) $(39,074) CONDENSED CONSOLIDATED BALANCE SHEETS FANNIE MAE ($ in millions) Q1 2026 Variance vs. QUARTERLY DATA Cash ASSETS Restricted cash Securities purchased under agreements to resell Mortgage loans: Investments in securities, at fair value Loans held for investment, at amortized cost Loans held for sale, at lower of cost or fair value Of Fannie Mae Of consolidated trusts Allowance for loan losses Total loans held for investment Total mortgage loans Total loans held for investment, net of allowance Advances to lenders Deferred tax assets, net Other assets Accrued interest receivable LIABILITIES Accrued interest payable Of Fannie Mae Debt © 2026 Fannie Mae See Notes to the Condensed Consolidated Financial Statements in the First Quarter 2026 Form 10-Q Other liabilities Of consolidated trusts Senior preferred stock FANNIE MAE STOCKHOLDERS' EQUITY Common stock, no par value, no maximum authorization— 1,308,762,703 shares issued and 1,158,087,567 shares outstanding Preferred stock, 700,000,000 shares are authorized— 555,374,922 shares issued and outstanding Accumulated deficit Accumulated other comprehensive income (loss) Treasury stock, at cost, 150,675,136 shares 3

Q1 2026 Q4 2025 Q3 2025 Q2 2025 Q1 2025 Q1 2026 Q4 2025 Q3 2025 Q2 2025 Q1 2025 $11,092 $11,428 $11,618 $11,630 $11,625 $98 $113 $129 $128 $125 67,993 68,993 75,484 83,310 79,218 630 714 844 924 872 65,219 73,142 76,745 81,558 81,509 547 620 614 617 587 60,605 57,504 55,368 51,709 49,919 655 591 599 542 499 4,069,960 4,072,606 4,076,794 4,079,998 4,094,365 38,250 38,122 37,745 37,151 36,900 4,130,565 4,130,110 4,132,162 4,131,707 4,144,284 38,905 38,713 38,344 37,693 37,399 3,452 4,111 3,262 3,420 2,376 42 54 46 49 33 Total interest-earning assets $4,278,321 $4,287,784 $4,299,271 $4,311,625 $4,319,012 $40,222 $40,214 $39,977 $39,411 $39,016 $21,431 $22,668 $14,467 $9,735 $9,837 $(194) $(223) $(154) $(103) $(105) 116,949 102,845 111,070 122,779 125,332 (1,310) (1,204) (1,249) (1,291) (1,292) 138,380 125,513 125,537 132,514 135,169 (1,504) (1,427) (1,403) (1,394) (1,397) 4,021,658 4,045,538 4,063,137 4,068,546 4,080,854 (31,520) (31,519) (31,390) (30,862) (30,618) Total interest-bearing liabilities $4,160,038 $4,171,051 $4,188,674 $4,201,060 $4,216,023 $(33,024) $(32,946) $(32,793) $(32,256) $(32,015) $7,198 $7,268 $7,184 $7,155 $7,001 3.53 % 3.96 % 4.44 % 4.40 % 4.30 % 3.71 4.14 4.47 4.44 4.40 3.35 3.39 3.20 3.03 2.88 4.32 4.11 4.33 4.19 4.00 3.76 3.74 3.70 3.64 3.60 3.77 3.75 3.71 3.65 3.61 4.87 5.25 5.64 5.73 5.56 Total interest-earning assets 3.76 % 3.75 % 3.72 % 3.66 % 3.61 % 3.62 % 3.94 % 4.26 % 4.23 % 4.27 % 4.48 4.68 4.50 4.21 4.12 4.35 4.55 4.47 4.21 4.13 3.14 3.12 3.09 3.03 3.00 Total interest-bearing liabilities 3.18 % 3.16 % 3.13 % 3.07 % 3.04 % 0.67 % 0.68 % 0.67 % 0.66 % 0.65 % (a) FANNIE MAE AVERAGE BALANCES OF ASSETS & LIABILITIES AND ANNUALIZED YIELDS ($ in millions, except rates) QUARTERLY DATA AVERAGE BALANCES INTEREST-EARNING ASSETS: Cash Investments in securities Securities purchased under agreements to resell Mortgage loans of Fannie Mae Mortgage loans: AVERAGE RATES EARNED / PAID INTEREST-EARNING ASSETS: Securities purchased under agreements to resell Cash INTEREST INCOME / (EXPENSE) Long-term funding debt Total debt of Fannie Mae Debt securities of consolidated trusts held by third parties Net interest income Mortgage loans of consolidated trusts Total mortgage loans(a) Advances to lenders Short-term funding debt INTEREST-BEARING LIABILITIES: Mortgage loans: Investments in securities Mortgage loans of Fannie Mae Mortgage loans of consolidated trusts Advances to lenders Total mortgage loans(a) Short-term funding debt Long-term funding debt Debt securities of consolidated trusts held by third parties Total debt of Fannie Mae Net interest yield / Net interest margin © 2026 Fannie Mae Average balance includes mortgage loans on nonaccrual status. Interest income includes loan fees, which primarily consist of yield maintenance revenue we recognized on the prepayment of multifamily mortgage loans and the amortization of upfront cash fees exchanged when we acquire the mortgage loan. For most components of the average balances, we use a daily weighted average of unpaid principal balance net of unamortized cost basis adjustments. When daily average balance information is not available, such as for mortgage loans, we use monthly averages. INTEREST-BEARING LIABILITIES: 4

Q1 2026 Q4 2025 Q3 2025 Q2 2025 Q1 2025 Q4 2025 Q1 2025 $(6,272) $(6,064) $(5,985) $(5,356) $(5,487) $(208) $(785) (103) (293) (269) (737) (24) 190 (79) 132 142 241 166 191 (10) (59) (43) (57) (51) (58) (36) 14 (7) $(6,286) $(6,272) $(6,064) $(5,985) $(5,356) $(14) $(930) $(2,320) $(2,413) $(2,486) $(2,366) $(2,399) $93 $79 (174) (5) (69) (209) 0 (169) (174) 243 120 167 122 61 123 182 (55) (22) (25) (33) (28) (33) (27) $(2,306) $(2,320) $(2,413) $(2,486) $(2,366) $14 $60 $(8,592) $(8,477) $(8,471) $(7,722) $(7,886) $(115) $(706) (277) (298) (338) (946) (24) 21 (253) 375 262 408 288 252 113 123 (98) (79) (76) (91) (64) (19) (34) $(8,592) $(8,592) $(8,477) $(8,471) $(7,722) $0 $(870) $(8,357) $(8,364) $(8,246) $(8,247) $(7,532) $7 $(825) (235) (228) (231) (224) (190) (7) (45) $(8,592) $(8,592) $(8,477) $(8,471) $(7,722) $0 $(870) 0.17 % 0.17 % 0.16 % 0.16 % 0.14 % 0.42 % 0.43 % 0.46 % 0.49 % 0.47 % 0.20 % 0.20 % 0.20 % 0.20 % 0.18 % 0.01 % 0.01 % 0.02 % 0.01 % 0.02 % 0.14 % 0.07 % 0.11 % 0.07 % 0.03 % 0.03 % 0.02 % 0.03 % 0.02 % 0.02 % 0.83 % 0.88 % 0.81 % 0.78 % 0.80 % 0.78 % 0.74 % 0.68 % 0.61 % 0.63 % (a) (b) (c) (d) (e) (f) CREDIT-RELATED INFORMATION FANNIE MAE ($ in millions, except ratio data) Q1 2026 Variance vs. QUARTERLY DATA Single-family allowance for credit losses: ALLOWANCE FOR CREDIT LOSSES(a) Beginning balance (Provision) benefit for credit losses Recoveries Write-offs Multifamily allowance for credit losses: Ending balance Beginning balance (Provision) benefit for credit losses Recoveries Write-offs Total allowance for credit losses: Ending balance Beginning balance (Provision) benefit for credit losses Recoveries Write-offs Ending balance COMPONENTS OF ALLOWANCE FOR CREDIT LOSSES Allowance for loan losses Allowance for Credit Losses Other(b) CREDIT LOSS RESERVES / GUARANTY BOOK(c) Single-Family Multifamily Total guaranty book Single-Family NET CHARGE-OFF RATIOS(d) Multifamily Total guaranty book 60+ DAYS DELINQUENT RATIOS Multifamily(f) Single-Family(e) © 2026 Fannie Mae The company's allowance for credit losses consists of allowance for loan losses, allowance for credit losses on advances of pre-foreclosure costs, accrued interest receivable, our guaranty loss reserves and credit reserves on our available-for-sale (“AFS”) debt securities. Pre-foreclosure costs represent advances for property taxes and insurance receivables. Consists of allowance for credit losses on advances of pre-foreclosure costs, accrued interest receivable, our guaranty loss reserves, and credit reserves on our AFS debt securities. The company's single-family, multifamily or total credit loss reserves as a percentage of the company's single-family conventional, multifamily or total guaranty books of business. For additional information, refer to “MD&A—Consolidated Credit Ratios and Select Credit Information” in the company’s applicable Form 10-Q and Form 10-K filings. The net charge-off ratio, which consists of allowance for loan losses, allowance for accrued interest receivable and reserve for guaranty losses, is based on annualized write-offs, net of recoveries, for single-family, multifamily, or total, where write-offs are when a loan is determined to be uncollectible or upon the redesignation of single-family mortgage loans from held for investment to held for sale, as a percentage of the average aggregate unpaid principal balance of the single-family conventional, multifamily, or total guaranty books of business during the period. For additional information, refer to “MD&A—Consolidated Credit Ratios and Select Credit Information” in the company's applicable Form 10-Q and Form 10-K filings. Single-Family 60+ days delinquent ratios are expressed as a percentage of our single-family conventional guaranty book of business, based on loan count. Single-family 60+ days delinquent loans are loans that are 60 days or more past due or in the foreclosure process. We revised our presentation of this single-family ratio to base it on loan count, which management uses to monitor the business, rather than unpaid principal balance. Multifamily 60+ days delinquent ratios are expressed as a percentage of our multifamily guaranty book of business, based on unpaid principal balance. Multifamily 60 + days delinquent loans are loans that are 60 days or more past due. 5

Q1 2026 Q4 2025 Q3 2025 Q2 2025 Q1 2025 Q4 2025 Q1 2025 * $(3) $(7) $(11) $(15) $3 $15 (37) (41) (44) (48) (52) 4 15 (18) (22) (25) (29) (33) 4 15 (18) (22) (25) (29) (33) 4 15 1,450 1,411 1,372 1,312 1,333 39 117 0.0 % (0.2)% (0.5)% (0.8)% (1.1)% 0.2 % 1.1 % (2.5)% (2.9)% (3.2)% (3.7)% (3.9)% 0.4 % 1.4 % (1.2)% (1.6)% (1.8)% (2.2)% (2.5)% 0.4 % 1.3 % (1.2)% (1.6)% (1.8)% (2.2)% (2.5)% 0.4 % 1.3 % $(8) $(12) $(15) $(19) $(23) $4 $15 (18) (22) (25) (29) (33) 4 15 4,419 4,423 4,443 4,446 4,462 (4) (43) (0.2)% (0.3)% (0.3)% (0.4)% (0.5)% 0.1 % 0.3 % (0.4)% (0.5)% (0.6)% (0.7)% (0.7)% 0.1 % 0.3 % $(40,782) $(44,481) $(48,457) $(52,107) $(55,854) $3,699 $15,072 3,720 3,527 3,859 3,317 3,661 193 59 (65) 0 (10) 7 (6) (65) (59) (398) (172) (127) (326) (92) (226) (306) 4,053 3,699 3,976 3,650 3,747 354 306 Standardized CET1 capital, ending balance $(36,729) $(40,782) $(44,481) $(48,457) $(52,107) $4,053 $15,378 * Represents amounts less than $500 million. (a) (b) (c) REGULATORY CAPITAL FANNIE MAE ($ in billions, except ratio and CET1 Capital data) AVAILABLE CAPITAL (DEFICIT)(a)(b) Q1 2026 Variance vs. QUARTERLY DATA Standardized Risk-based capital metrics Total capital (statutory) CET1 capital Adjusted total capital Tier 1 capital Total capital (statutory) ratio Risk-weighted assets CET1 capital ratio Tier 1 capital ratio Adjusted total capital ratio Core capital (statutory) Leverage-based capital metrics Tier 1 capital Adjusted total assets Tier 1 capital ratio Core capital (statutory) ratio Changes in standardized CET1 capital CET1 CAPITAL ROLLFORWARD ($ in millions) Standardized CET1 capital beginning balance Net income Less: Changes in deferred tax assets(c) Changes in accumulated other comprehensive income (loss), net of taxes © 2026 Fannie Mae The company began reporting its capital position under the enterprise regulatory capital framework beginning with the quarterly period ended December 31, 2022. The enterprise regulatory capital framework has a transition period for compliance, as described in the company's 2025 Form 10-K. While the company is in conservatorship, the company is not required to comply with the minimum capital or buffer requirements. Represents changes in deferred tax assets arising from temporary differences that exceed 10% of common equity tier 1 (CET1) capital and other regulatory adjustments. Ratios are calculated as a percentage of risk-weighted assets for risk-based capital metrics and as a percentage of adjusted total assets for leverage capital metrics. Negative capital amounts and ratios indicate capital deficits. Variances for ratios represent arithmetic differences, expressed in percentage points. 6

Q1 2026 Q4 2025 Q3 2025 Q2 2025 Q1 2025 Q4 2025 Q1 2025 $5,978 $6,043 $5,992 $5,992 $5,866 $(65) $112 61 43 104 69 65 18 (4) 6,039 6,086 6,096 6,061 5,931 (47) 108 204 (273) (22) 197 82 477 122 (257) (14) 127 (20) 1 (243) (258) (53) (287) 105 177 83 234 (136) (103) (293) (269) (737) (24) 190 (79) (601) (750) (669) (687) (812) 149 211 (918) (921) (929) (918) (920) 3 2 (280) (288) (330) (318) (407) 8 127 (90) (173) (129) (131) (173) 83 83 (1,889) (2,132) (2,057) (2,054) (2,312) 243 423 3,994 3,374 3,875 3,447 3,678 620 316 (820) (697) (790) (711) (760) (123) (60) $3,174 $2,677 $3,085 $2,736 $2,918 $497 $256 $3,564 $3,577 $3,588 $3,597 $3,610 48.8 48.7 48.5 48.3 48.1 $861 $859 $873 $874 $862 406 418 431 458 421 27 28 29 30 31 36 % 37 % 37 % 39 % 37 % 0.58 % 0.58 % 0.54 % 0.53 % 0.56 % 5 5 4 5 5 $2.9 $2.5 $2.3 $2.7 $3.6 3.0 3.1 3.2 3.5 2.7 0.2 0.2 0.2 0.3 0.2 $6.1 $5.8 $5.7 $6.5 $6.5 24.8 23.3 23.4 25.8 27.0 (a) (b) (c) (d) (e) (f) (g) (h) SEGMENT RESULTS - SINGLE-FAMILY SELECTED FINANCIAL DATA FANNIE MAE SELECTED SINGLE-FAMILY INCOME STATEMENT DATA ($ in millions) Q1 2026 Variance vs. QUARTERLY DATA Fee and other income Net interest income Net revenues Fair value gains (losses), net Other gains (losses), net Investment gains (losses), net Non-interest expense (Provision) benefit for credit losses Administrative expenses Legislative assessments Other income (expense), net Credit enhancement expense Income before federal income taxes Total non-interest expense Provision for federal income taxes Net Income SELECTED SINGLE-FAMILY HIGHLIGHTS Average Charged Guaranty Fee on Conventional Book of Business, net of TCCA fees (bps)(b) Average Conventional Guaranty Book of Business ($ in billions)(a) SINGLE-FAMILY CREDIT RISK TRANSFER ($ in billions) UPB outstanding of single-family loans in a CIRTTM transaction(d) UPB outstanding of single-family loans in a Connecticut Avenue Securities® transaction(c) Single-family conventional loan population consists of: (a) single-family conventional mortgage loans of Fannie Mae and (b) single-family conventional mortgage loans underlying Fannie Mae MBS other than loans underlying Freddie Mac securities that Fannie Mae has resecuritized. It excludes non-Fannie Mae single-family mortgage-related securities held in the retained mortgage portfolio for which Fannie Mae does not provide a guaranty. Conventional refers to mortgage loans and mortgage-related securities that are not guaranteed or insured, in whole or in part, by the U.S. government or one of its agencies. Percentage of single-family conventional guaranty book of business covered by a CRT transaction(e) UPB outstanding of single-family loans in other CRT transactions SINGLE-FAMILY PROBLEM LOAN STATISTICS REO Ending Inventory (number of properties, in thousands) Serious delinquency rate(f) Payment Deferrals Single-Family Loan Workouts ($ in billions)(g): Modifications Other(h) Number of Loan Workouts (in thousands) Total Loan Workouts Includes repayment plans and foreclosure alternatives. Repayment plans reflect only those plans associated with loans that were 60 days or more delinquent. © 2026 Fannie Mae Represents, on an annualized basis, the average of the base guaranty fees charged weighted by unpaid principal balance during the period for the company's single-family conventional guaranty arrangements plus the recognition of any upfront cash payments relating to these guaranty arrangements based on an estimated average life at the time of acquisition (in basis points). Excludes the impact of TCCA. Outstanding unpaid principal balance represents the underlying loan balance, which is different from the reference pool balance for CAS and some lender risk-sharing transactions. Based on the unpaid principal balance of the single-family conventional guaranty book of business as of period end. Includes mortgage pool insurance transactions. Excludes loans in an active forbearance arrangement, trial modifications, and repayment plans that have been initiated but not completed. Single-family serious delinquency (“SDQ”) rate refers to single-family loans that are 90 days or more past due or in the foreclosure process, expressed as a percentage of the company’s single-family conventional guaranty book of business, based on loan count. 7

Q1 2026 Q4 2025 Q3 2025 Q2 2025 Q1 2025 Q4 2025 Q1 2025 $55 $60 $72 $64 $50 $(5) $5 44 37 18 20 14 7 30 $99 $97 $90 $84 $64 $2 $35 76 % 76 % 77 % 77 % 77 % 6 % 6 % 7 % 6 % 6 % 757 759 756 757 757 7 % 6 % 7 % 7 % 6 % 34 % 34 % 38 % 37 % 38 % 96 % 96 % 98 % 98 % 99 % 94 % 95 % 95 % 94 % 94 % 5 % 4 % 7 % 6 % 6 % Q1 2026 Q4 2025 Q3 2025 Q2 2025 Q1 2025 56 % 62 % 80 % 76 % 78 % 11 % 10 % 10 % 12 % 12 % 33 % 28 % 10 % 12 % 10 % (a) (b) (c) (d) SEGMENT RESULTS - SINGLE-FAMILY CONVENTIONAL LOAN ACQUISITIONS FANNIE MAE ($ in billions) SELECTED SINGLE-FAMILY CONVENTIONAL LOAN ACQUISITION DATA(a) Q1 2026 Variance vs. QUARTERLY DATA Purchase Conventional Loan Acquisition by Purpose: Refinance Total Conventional Loan Acquisitions Conventional Loan Credit Characteristics (by acquisition period): Original LTV Ratio >95% Weighted Average Original Loan-to-Value (“LTV”) Ratio Weighted-Average FICO Credit Score(b) FICO Credit Score <680(b) Fixed-rate Debt-to-Income (“DTI”) Ratio >43%(c) HomeReady(d) Primary Residence Excludes loans for which this information is not readily available. From time to time, the company revises its guidelines for determining a borrower's DTI ratio. The amount of income reported by a borrower and used to qualify for a mortgage may not represent the borrower's total income; therefore, the DTI ratios reported may be higher than borrowers' actual DTI ratios. FICO credit score is as of loan origination, as reported by the seller of the mortgage loan. Refers to HomeReady® mortgage loans, a low down payment mortgage product offered by the company that is designed for creditworthy low-income borrowers. HomeReady allows up to 97% loan-to-value ratio financing for home purchases. The company offers additional low down payment mortgage products that are not HomeReady loans; therefore, this category is not representative of all high LTV ratio single-family loans acquired or in the single-family conventional guaranty book of business for the periods shown. See the “Original LTV Ratio > 95%” category for information on the single-family loans acquired or in the single- family conventional guaranty book of business with original LTV ratios greater than 95%. © 2026 Fannie Mae ACQUISITION BY LOAN PURPOSE Cash-out refinance Purchase Other refinance Single-family conventional loan population consists of: (a) single-family conventional mortgage loans of Fannie Mae and (b) single-family conventional mortgage loans underlying Fannie Mae MBS other than loans underlying Freddie Mac securities that Fannie Mae has resecuritized. It excludes non-Fannie Mae single-family mortgage-related securities held in the retained mortgage portfolio for which Fannie Mae does not provide a guaranty. Conventional refers to mortgage loans and mortgage-related securities that are not guaranteed or insured, in whole or in part, by the U.S. government or one of its agencies. 8

2026 2025 2024 2023 2022 - 2020 2019 - 2009 2008 & Earlier Overall Book / Total $64.1 $309.2 $253.4 $209.9 $2,031.3 $644.5 $46.7 $3,559.1 $361,047 $328,985 $308,361 $293,282 $241,064 $125,460 $70,935 $210,891 2 % 9 % 7 % 6 % 57 % 18 % 1 % 100 % 35 % 42 % 73 % 78 % 46 % 34 % 8 % 46 % 0.00 % 0.20 % 0.61 % 0.90 % 0.49 % 0.61 % 1.69 % 0.58 % 0 % 2 % 5 % 7 % 43 % 32 % 11 % 100 % 76 % 77 % 78 % 79 % 72 % 76 % 75 % 74 % 5 % 7 % 8 % 8 % 4 % 8 % 9 % 5 % 76 % 75 % 73 % 70 % 49 % 31 % 26 % 51 % 757 756 757 754 756 746 694 753 7 % 7 % 5 % 5 % 6 % 11 % 40 % 7 % 6.0 % 6.4 % 6.5 % 6.5 % 3.3 % 4.1 % 5.5 % 4.2 % Q1 2026 2025 2024 2023 2022 51 % 51 % 50 % 51 % 52 % 753 753 753 753 752 (a) (b) (c) (d) (e) (f) (g) FANNIE MAE SEGMENT RESULTS - SINGLE-FAMILY CONVENTIONAL GUARANTY BOOK OF BUSINESS As of March 31, 2026 SELECTED CREDIT CHARACTERISTICS OF SINGLE-FAMILY CONVENTIONAL GUARANTY BOOK OF BUSINESS(a)(b) Average UPB Total UPB ($ in billions) BY ORIGINATION YEAR Share of Loans with Credit Enhancement(c) Share of SF Conventional Guaranty Book Serious Delinquency Rate (by loan count)(d) Share of Seriously Delinquent Loan Population(e) OLTV Ratio >95% Weighted-Average OLTV Ratio Weighted-Average FICO Credit Score(g) Weighted-Average Mark-to-Market LTV Ratio(f) FICO Credit Score <680(g) Weighted-Average Borrower Interest Rate Single-Family Conventional Guaranty Book of Business Credit Characteristics Weighted-Average FICO Credit Score(g) Single-Family Weighted-Average Mark-to-Market Loan-to-Value Ratio Single-family conventional loan population consists of: (a) single-family conventional mortgage loans of Fannie Mae and (b) single-family conventional mortgage loans underlying Fannie Mae MBS other than loans underlying Freddie Mac securities that Fannie Mae has resecuritized. It excludes non-Fannie Mae single-family mortgage-related securities held in the retained mortgage portfolio for which Fannie Mae does not provide a guaranty. Conventional refers to mortgage loans and mortgage-related securities that are not guaranteed or insured, in whole or in part, by the U.S. government or one of its agencies. Unless otherwise indicated, ratios are calculated based on the aggregate unpaid principal balance of single-family loans for each category divided by the aggregate unpaid principal balance of loans in the single-family conventional guaranty book of business. Loans with multiple product features are included in all applicable categories. Percentage of loans in each category, measured by unpaid principal balance, included in an agreement used to reduce credit risk by requiring collateral, letters of credit, mortgage insurance, corporate guarantees, inclusion in a credit risk transfer transaction reference pool, or other agreement that provides for Fannie Mae's compensation to some degree in the event of a financial loss relating to the loan. Single-family serious delinquency (“SDQ”) rate refers to single-family loans that are 90 days or more past due or in the foreclosure process, expressed as a percentage of the company’s single-family conventional guaranty book of business, based on loan count. Single-family SDQ rate for loans in a particular category refers to SDQ loans in the applicable category, divided by the number of loans in the single-family conventional guaranty book of business in that category. Calculated based on the number of single-family loans that were seriously delinquent for each category divided by the total number of single-family conventional loans that were seriously delinquent. The average estimated mark-to-market LTV ratio is based on the unpaid principal balance of the loan divided by the estimated current value of the property at period end, which the company calculates using an internal valuation model that estimates periodic changes in home value. Excludes loans for which this information is not readily available. FICO credit score is as of loan origination, as reported by the seller of the mortgage loan. © 2026 Fannie Mae 9

OLTV Ratio > 95% Home Ready(g) FICO Credit Score < 680(f) DTI Ratio > 43%(h) $188.0 $137.1 $258.9 $970.7 $186,842 $184,164 $162,776 $240,222 5 % 4 % 7 % 27 % 86 % 77 % 40 % 53 % 1.29 % 1.08 % 2.02 % 0.89 % 13 % 8 % 33 % 37 % 100 % 86 % 74 % 76 % 100 % 31 % 6 % 6 % 69 % 66 % 48 % 56 % 741 745 652 744 8 % 8 % 100 % 9 % 4.9 % 4.7 % 4.6 % 4.6 % (a) (b) (c) (d) (e) (f) (g) (h) FANNIE MAE SEGMENT RESULTS - SINGLE-FAMILY CONVENTIONAL GUARANTY BOOK OF BUSINESS As of March 31, 2026 SELECTED CREDIT CHARACTERISTICS OF SINGLE-FAMILY CONVENTIONAL GUARANTY BOOK OF BUSINESS(a) Average UPB Total UPB ($ in billions) BY LOAN FEATURE Share of Loans with Credit Enhancement(b) Share of SF Conventional Guaranty Book Serious Delinquency Rate (by loan count)(c) Share of Seriously Delinquent Loan Population(d) OLTV Ratio >95% Weighted-Average OLTV Ratio Weighted-Average FICO Credit Score(f) Weighted-Average Mark-to-Market LTV Ratio(e) FICO Credit Score <680(f) Weighted-Average Borrower Interest Rate Single-family conventional loan population consists of: (a) single-family conventional mortgage loans of Fannie Mae and (b) single-family conventional mortgage loans underlying Fannie Mae MBS other than loans underlying Freddie Mac securities that Fannie Mae has resecuritized. It excludes non-Fannie Mae single-family mortgage-related securities held in the retained mortgage portfolio for which Fannie Mae does not provide a guaranty. Conventional refers to mortgage loans and mortgage-related securities that are not guaranteed or insured, in whole or in part, by the U.S. government or one of its agencies. Percentage of loans in each category, measured by unpaid principal balance, included in an agreement used to reduce credit risk by requiring collateral, letters of credit, mortgage insurance, corporate guarantees, inclusion in a credit risk transfer transaction reference pool, or other agreement that provides for Fannie Mae's compensation to some degree in the event of a financial loss relating to the loan. Single-family serious delinquency (“SDQ”) rate refers to single-family loans that are 90 days or more past due or in the foreclosure process, expressed as a percentage of the company’s single-family conventional guaranty book of business, based on loan count. Single-family SDQ rate for loans in a particular category refers to SDQ loans in the applicable category, divided by the number of loans in the single-family conventional guaranty book of business in that category. Calculated based on the number of single-family loans that were seriously delinquent for each category divided by the total number of single-family conventional loans that were seriously delinquent. © 2026 Fannie Mae Refers to HomeReady® mortgage loans, a low down payment mortgage product offered by the company that is designed for creditworthy low-income borrowers. HomeReady allows up to 97% loan-to-value ratio financing for home purchases. The company offers additional low down payment mortgage products that are not HomeReady loans; therefore, this category is not representative of all high LTV ratio single-family loans acquired or in the single-family conventional guaranty book of business for the periods shown. See the “OLTV Ratio > 95%” category for information on the single-family loans acquired or in the single-family conventional guaranty book of business with original LTV ratios greater than 95%. Excludes loans for which this information is not readily available. From time to time, the company revises its guidelines for determining a borrower's DTI ratio. The amount of income reported by a borrower and used to qualify for a mortgage may not represent the borrower's total income; therefore, the DTI ratios reported may be higher than borrowers' actual DTI ratios. The average estimated mark-to-market LTV ratio is based on the unpaid principal balance of the loan divided by the estimated current value of the property at period end, which the company calculates using an internal valuation model that estimates periodic changes in home value. Excludes loans for which this information is not readily available. FICO credit score is as of loan origination, as reported by the seller of the mortgage loan. 10

Q1 2026 Q4 2025 Q3 2025 Q2 2025 Q1 2025 Q4 2025 Q1 2025 $1,220 $1,225 $1,192 $1,163 $1,135 $(5) $85 21 20 19 17 19 1 2 1,241 1,245 1,211 1,180 1,154 (4) 87 (83) 16 35 14 41 (99) (124) (20) 19 (7) 1 (2) (39) (18) (103) 35 28 15 39 (138) (142) (174) (5) (69) (209) 0 (169) (174) (144) (171) (150) (160) (180) 27 36 (13) (15) (14) (21) (11) 2 (2) (78) (80) (79) (82) (72) 2 (6) (59) 27 33 (16) (24) (86) (35) (294) (239) (210) (279) (287) (55) (7) 670 1,036 960 707 906 (366) (236) (124) (186) (186) (126) (163) 62 39 $546 $850 $774 $581 $743 $(304) $(197) $17.1 $25.8 $18.7 $17.4 $11.8 $(8.7) $5.3 542.5 534.7 521.3 510.8 504.5 7.8 38.0 71.1 71.6 72.4 73.3 74.1 (0.5) (3.0) $104,264 $105,740 $107,712 $109,381 $111,249 $(1,476) $(6,985) 66,545 67,040 67,929 69,114 55,894 (495) 10,651 31 % 32 % 34 % 35 % 33 % (1)% (2)% 0.78 % 0.74 % 0.68 % 0.61 % 0.63 % 6 % 6 % 6 % 6 % 6 % 201 181 188 176 148 (a) (b) (c) SEGMENT RESULTS - MULTIFAMILY SELECTED FINANCIAL DATA FANNIE MAE SELECTED MULTIFAMILY INCOME STATEMENT DATA ($ in millions) Q1 2026 Variance vs. QUARTERLY DATA Fee and other income Net interest income Net revenues Fair value gains (losses), net Other gains (losses), net Investment gains (losses), net Non-interest expense (Provision) benefit for credit losses Administrative expenses Legislative assessments Other income (expense), net Credit enhancement expense Income before federal income taxes Total non-interest expense Provision for federal income taxes Net income SELECTED MULTIFAMILY GUARANTY BOOK OF BUSINESS DATA ($ in billions) UPB outstanding of guaranty book of business(a) New business volume Average charged guaranty fee (in bps) at period end UPB outstanding of multifamily loans in a multifamily CIRT transaction MULTIFAMILY CREDIT RISK TRANSFER ($ in millions) UPB outstanding of multifamily loans in a Multifamily Connecticut Avenue Securities transaction MULTIFAMILY PROBLEM LOAN STATISTICS Percent criticized(c) Serious delinquency rate(b) REO ending inventory (number of properties) © 2026 Fannie Mae Criticized loans represent loans classified as “Special Mention,” “Substandard” or “Doubtful.” Loans classified as “Special Mention” refers to loans that are otherwise performing but have potential weaknesses that, if left uncorrected, may result in deterioration in the borrower’s ability to repay in full. Loans classified as “Substandard” have a well-defined weakness that jeopardizes the timely full repayment. “Doubtful” refers to a loan with a weakness that makes collection or liquidation in full highly questionable and improbable based on existing conditions and values. For Multifamily, serious delinquency rate refers to multifamily loans that are 60 days or more past due, expressed as a percentage of the company’s multifamily guaranty book of business as a percentage of loans in each category, based on unpaid principal balance. The multifamily guaranty book of business consists of: (a) multifamily mortgage loans of Fannie Mae; (b) multifamily mortgage loans underlying Fannie Mae MBS; and (c) other credit enhancements that the company provided on multifamily mortgage assets. It excludes non-Fannie Mae multifamily mortgage-related securities held in the retained mortgage portfolio for which Fannie Mae does not provide a guaranty. Percentage of multifamily guaranty book in a multifamily CRT transaction 11

Q1 2026 2025 2024 2023 2022 $17.1 $73.7 $55.1 $52.9 $69.2 63 % 62 % 62 % 59 % 59 % 669 3,308 2,602 2,812 3,572 100 % 100 % 99 % 100 % 100 % 99 % 99 % 99 % 99 % 99 % 68 % 66 % 61 % 63 % 53 % 61 % 60 % 59 % 57 % 56 % 67 % 67 % 66 % 63 % 63 % 25 % 28 % 31 % 32 % 39 % 88 % 88 % 89 % 93 % 86 % 11 % 11 % 11 % 6 % 14 % 1 % 1 % 1 % 1 % 0 % 100 % 99 % 100 % 99 % 78 % * 1 % * 1 % 22 % Q1 2026 $2.15 0.79 0.73 0.69 0.68 0.65 0.63 0.50 0.48 0.45 $7.75 45.3 % * Represents less than 0.5% of variable rate multifamily loan acquisitions (a) (b) (c) (d) SEGMENT RESULTS - MULTIFAMILY LOAN ACQUISITIONS FANNIE MAE Categories are not mutually exclusive SELECTED MULTIFAMILY LOAN ACQUISITION DATA(a) Weighted-Average OLTV Ratio Total UPB ($ in billions) BY ACQUISITION PERIOD % Lender Recourse(b) Loan Count % DUS(c) % Full Interest-Only Weighted-Average OLTV Ratio on Non-Full Interest-Only Acquisitions Weighted-Average OLTV Ratio on Full Interest-Only Acquisitions % Partial Interest-Only(d) Original Loan-to-Value Ratio less than or equal to 70% Original Loan-to-Value Ratio greater than 70% and less than or equal to 80% Original Loan-to-Value Ratio greater than 80% Fixed ACQUISITION BY NOTE TYPE Variable-rate TOP 10 METROPOLITAN STATISTICAL AREAS BY 2026 ACQUISITION UPB ($ in billions) Los Angeles New York Seattle Dallas Chicago Atlanta Washington, D.C. Boston Minneapolis San Jose Share of Acquisitions Total Top 10 UPB Includes any loan that was underwritten with an interest-only term less than the term of the loan, regardless of whether it is currently in its interest-only period. © 2026 Fannie Mae The multifamily guaranty book of business consists of: (a) multifamily mortgage loans of Fannie Mae; (b) multifamily mortgage loans underlying Fannie Mae MBS; and (c) other credit enhancements that the company provided on multifamily mortgage assets. It excludes non-Fannie Mae multifamily mortgage-related securities held in the retained mortgage portfolio for which Fannie Mae does not provide a guaranty. Represents the percentage of the company's multifamily guaranty book of business with lender risk-sharing agreements in place, measured by unpaid principal balance. Under the Delegated Underwriting and Servicing (“DUS®”) program, Fannie Mae acquires individual, newly originated mortgages from specially approved DUS lenders using DUS underwriting standards and/or DUS loan documents. We delegate to these lenders the authority to underwrite and service multifamily loans on our behalf in accordance with our standards and requirements, and DUS lenders typically share a portion of the credit risk on our multifamily loans for the life of the loans. 12

2026 2025 2024 2023 2022 2021 - 2017 2016 & Earlier Overall Book $17.1 $73.6 $54.7 $51.0 $62.4 $252.7 $31.0 $542.5 3 % 14 % 10 % 9 % 11 % 47 % 6 % 100 % 669 3,299 2,568 2,684 3,260 14,702 3,523 30,705 $26 $22 $21 $19 $19 $17 $9 $18 63 % 62 % 62 % 59 % 59 % 65 % 67 % 63 % 1.7 1.6 1.6 1.5 1.7 2.2 2.1 1.9 0 % 0%* 3 % 6 % 9 % 4 % 5 % 4 % 100 % 99 % 100 % 99 % 83 % 96 % 85 % 95 % 68 % 66 % 62 % 64 % 55 % 39 % 25 % 49 % 25 % 28 % 31 % 31 % 37 % 51 % 47 % 41 % 33 % 33 % 34 % 40 % 39 % 45 % 71 % 45 % 0.00 % 0.00 % 0.58 % 1.29 % 1.75 % 0.61 % 2.07 % 0.78 % 0 % 0%* 5 % 8 % 12 % 5 % 9 % 6 % As of March 31, 2026 $18.5 26.7 51.4 70.2 250.4 94.6 30.7 $542.5 * Represents less than 0.5% of multifamily guaranty book of business (a) (b) (c) (d) (e) (f) SEGMENT RESULTS - MULTIFAMILY GUARANTY BOOK OF BUSINESS FANNIE MAE As of March 31, 2026 Categories are not mutually exclusive Total UPB ($ in billions) SELECTED CREDIT CHARACTERISTICS OF MULTIFAMILY GUARANTY BOOK OF BUSINESS(a) ACQUISITION YEAR Loan Count % of Multifamily Guaranty Book Average UPB ($ in millions) Weighted-Average OLTV Ratio % with DSCR Below 1.0(b) Weighted-Average DSCR(b) % Full Interest-Only % Fixed Rate % Partial Interest-Only(c) % Small Balance Loans(d) % Criticized(f) Serious Delinquency Rate(e) UPB BY MATURITY YEAR ($ in billions)(a) 2026 2027 2029 2028 2033 - 2035 2030 - 2032 Multifamily serious delinquency rate refers to multifamily loans that are 60 days or more past due, expressed as a percentage of the company’s multifamily guaranty book of business, based on unpaid principal balance. Multifamily serious delinquency rate for loans in a particular category (such as acquisition year, asset class or targeted affordable segment), refers to seriously delinquent loans in the applicable category, divided by the unpaid principal balance of the loans in the multifamily guaranty book of business in that category. Small balance loans refer to multifamily loans with an original unpaid principal balance of up to $9 million. Small balance loans are included within the asset class categories referenced above. The company presents this metric in the table based on loan count rather than unpaid principal balance. Small balance loans comprised 10% of the company's multifamily guaranty book of business as of March 31, 2026, based on the unpaid principal balance of the loans. Criticized loans represent loans classified as “Special Mention,” “Substandard” or “Doubtful.” Loans classified as “Special Mention” refers to loans that are otherwise performing but have potential weaknesses that, if left uncorrected, may result in deterioration in the borrower’s ability to repay in full. Loans classified as “Substandard” have a well-defined weakness that jeopardizes the timely full repayment. “Doubtful” refers to a loan with a weakness that makes collection or liquidation in full highly questionable and improbable based on existing conditions and values. © 2026 Fannie Mae Other Total Includes any loan that was underwritten with an interest-only term less than the term of the loan, regardless of whether it is currently in its interest-only period. The multifamily guaranty book of business consists of: (a) multifamily mortgage loans of Fannie Mae; (b) multifamily mortgage loans underlying Fannie Mae MBS; and (c) other credit enhancements that the company provided on multifamily mortgage assets. It excludes non- Fannie Mae multifamily mortgage-related securities held in the retained mortgage portfolio for which Fannie Mae does not provide a guaranty. Estimates of current DSCRs are based on the latest available income information covering a 12-month period, from quarterly and annual statements for these properties including the related debt service. When an annual statement is the latest statement available, it is used. When operating statement information is not available, the underwritten DSCR is used. Co-op loans are excluded from this metric. 13

Conventional / Co-op(g) Seniors Housing(g) Student Housing(g) Manufactured Housing(g) Affordable(h) $497.4 $11.0 $11.5 $22.6 $66.7 92 % 2 % 2 % 4 % 12 % 27,892 374 413 2,026 4,149 $17.8 $29.3 $27.9 $11.1 $16.1 63 % 64 % 65 % 60 % 67 % 1.9 1.7 1.8 2.3 1.8 4 % 12 % 4 % 1 % 5 % 95 % 82 % 87 % 96 % 91 % 50 % 19 % 37 % 45 % 32 % 40 % 63 % 58 % 43 % 44 % 43 % 20 % 39 % 66 % 49 % 0.78 % 1.27 % 1.87 % 0.07 % 0.29 % 6 % 17 % 7 % 1 % 8 % (a) (b) (c) (d) (e) (f) (g) (h) SEGMENT RESULTS - MULTIFAMILY GUARANTY BOOK OF BUSINESS FANNIE MAE As of March 31, 2026 Categories are not mutually exclusive Total UPB ($ in billions) SELECTED CREDIT CHARACTERISTICS OF MULTIFAMILY GUARANTY BOOK OF BUSINESS(a) BY ASSET CLASS / TARGETED AFFORDABLE SEGMENT Loan Count % of Multifamily Guaranty Book Average UPB ($ in millions) Weighted-Average OLTV Ratio % with DSCR Below 1.0(b) Weighted-Average DSCR(b) % Full Interest-Only % Fixed Rate % Partial Interest-Only(c) % Small Balance Loans(d) % Criticized(f) Serious Delinquency Rate(e) The multifamily guaranty book of business consists of: (a) multifamily mortgage loans of Fannie Mae; (b) multifamily mortgage loans underlying Fannie Mae MBS; and (c) other credit enhancements that the company provided on multifamily mortgage assets. It excludes non-Fannie Mae multifamily mortgage-related securities held in the retained mortgage portfolio for which Fannie Mae does not provide a guaranty. Estimates of current DSCRs are based on the latest available income information covering a 12-month period, from quarterly and annual statements for these properties including the related debt service. When an annual statement is the latest statement available, it is used. When operating statement information is not available, the underwritten DSCR is used. Co-op loans are excluded from this metric. © 2026 Fannie Mae Represents Multifamily Affordable Housing loans, which are defined as financing for properties that are under an agreement that provides long-term affordability, such as properties with rent subsidies or income restrictions. See https://multifamily.fanniemae.com/financing-options for definitions. Loans with multiple product features are included in all applicable categories. Criticized loans represent loans classified as “Special Mention,” “Substandard” or “Doubtful.” Loans classified as “Special Mention” refers to loans that are otherwise performing but have potential weaknesses that, if left uncorrected, may result in deterioration in the borrower’s ability to repay in full. Loans classified as “Substandard” have a well-defined weakness that jeopardizes the timely full repayment. “Doubtful” refers to a loan with a weakness that makes collection or liquidation in full highly questionable and improbable based on existing conditions and values. Multifamily serious delinquency rate refers to multifamily loans that are 60 days or more past due, expressed as a percentage of the company’s multifamily guaranty book of business, based on unpaid principal balance. Multifamily serious delinquency rate for loans in a particular category (such as acquisition year, asset class or targeted affordable segment), refers to seriously delinquent loans in the applicable category, divided by the unpaid principal balance of the loans in the multifamily guaranty book of business in that category. Small balance loans refer to multifamily loans with an original unpaid principal balance of up to $9 million. Small balance loans are included within the asset class categories referenced above. The company presents this metric in the table based on loan count rather than unpaid principal balance. Includes any loan that was underwritten with an interest-only term less than the term of the loan, regardless of whether it is currently in its interest-only period. 14

2013 2014 2015 2016 2017 2018 2019 2020 2021 2022 2023 2024 2025 2026 0.1 % 1.2 % 0.3 % 0.2 % 0.3 % 0.1 % 0.2 % 0.2 % 0.1 % 0.4 % 0.3 % 0.0%* 0.0%* 0.0%* 2013 2014 2015 2016 2017 2018 2019 2020 2021 2022 2023 2024 2025 Q1 2026 118 62 12 13 11 16 12 14 31 28 61 139 181 201 * Represents less than 0.05% of cumulative total credit loss rate, net by acquisition year. (a) SEGMENT RESULTS - MULTIFAMILY PROBLEM LOAN STATISTICS FANNIE MAE © 2026 Fannie Mae Cumulative total credit loss rate, net is the cumulative net credit losses through March 31, 2026 on the multifamily loans that were acquired in the applicable period, as a percentage of the total acquired unpaid principal balance of multifamily loans that were acquired in the applicable period. Cumulative net credit losses include the expected benefit of freestanding loss-sharing arrangements, primarily multifamily DUS lender risk-sharing transactions. The rate for 2014 acquisitions was primarily driven by the write-off of a seniors housing portfolio in 2023. Cumulative Total Credit Loss Rate, Net by Acquisition Year through March 2026(a) REO Ending Inventory (number of properties) 15